
Will Trump be the winning dealmaker?

Global Macro Updates
The Hormuz risk premium and its unequal toll. The fragile possibility of a negotiated end to the US-Iran conflict is generating cautious optimism across financial markets, yet the broader macro backdrop tells a more complicated and structurally divided story, one in which geopolitical relief, monetary constraint and energy windfalls converge without benefitting all Americans equally.
Reports that the US and Iran are nearing a one-page, 14-point memorandum of understanding (covering a moratorium on nuclear enrichment, a framework for formal nuclear talks and the potential reopening of the Strait of Hormuz) have been enough to lift equities and push oil prices lower. The US President's decision to pause Project Freedom, the naval escort initiative through Hormuz, signals a diplomatic opening, reinforced by China's Foreign Minister Wang Yi pressing Tehran directly for a resolution. Yet the absence of any formal Iranian response, combined with a history of failed ceasefire attempts and ongoing attacks on Gulf infrastructure, counsels against premature confidence. Diplomatic progress of this nature tends to be nonlinear and the status quo remains highly susceptible to reversal.
Against this geopolitical backdrop, Fedspeak has been notably cautious. St Louis Fed President Alberto Musalem stated that policy may remain on hold ‘for some time,’ citing inflation running above the 2% target and expressing greater concern about price pressures than labour market conditions. Chicago Fed President Austan Goolsbee added a heterodox dimension: while other officials have argued that AI-driven productivity gains will be disinflationary, Goolsbee warned that if businesses and households anticipate and front-run those productivity gains, the result could be an inflationary spending pulse that forces rates higher, not lower. Markets have absorbed this hawkish messaging swiftly, as rate cut expectations through year-end have been virtually erased, even as Iran war optimism briefly revived them earlier this week.
The energy sector sits at the intersection of these dynamics, reaping a spectacular windfall. US crude oil exports surged to a record 5.2 million barrels per day (bpd) in April, as reported by the Financial Times, up more than thirty percent from pre-war levels, as Asian and European buyers scrambled to replace disrupted Middle Eastern supply. Brent crude has risen 67.5% since the start of 2026 and Gulf Coast refineries are operating at historic capacity, with new trade routes stretching from Texas to Australia.
That asymmetry is nowhere more visible than at the pump. Research by the New York Fed finds a stark K-shaped pattern in gasoline consumption during March 2026: high-income households (earning over $125,000 per year) absorbed the price shock and reduced real consumption by 1%, while low-income households (earning under $40,000 per year) cut real gas usage by 7%, even as their nominal spending still rose 12%. The divergence was quantitatively larger than during the comparable Russia-Ukraine energy shock of 2022, suggesting that the structural wedge between income groups is widening with each successive crisis.
A ceasefire and the reopening of Hormuz would ease oil prices, restore some breathing room for lower-income households and potentially give the Fed the cover it needs to eventually pivot toward cuts. But until that deal is inked - and remains in force - the macro environment is one in which a prolonged period of elevated rates, record energy sector profits and regressive fuel costs continues to trace precisely the K-shaped trajectory that has come to define this economic cycle.
Corporate Earnings Calendar
Thursday: Airbnb, Block, Cloudflare, Coinbase, CoreWeave, Duke Energy, Gilead Sciences, IREN, McDonald’s, Rocket Lab, Shell, The Trade Desk, Unity, Viatris, Wheaton Precious Metals, Wynn Resorts
Monday: Barrick Mining, Fox Corp
Tuesday: JD.com, Siemens Energy
Wednesday: Alibaba Group, Cisco Systems, Siemens, Takeda Pharmaceutical, Tencent
Global market indices
US Stock Indices Price Performance
Nasdaq 100 +4.18% MTD and +13.26% YTD
Dow Jones Industrial Average -0.71% MTD and +2.57% YTD
NYSE +0.60% MTD and +5.82% YTD
S&P 500 +2.17% MTD and +7.59% YTD
The S&P 500 is +3.21% over the past seven days, with 6 of the 11 sectors up MTD. The Equally Weighted version of the S&P 500 is +2.22% over this past week and +6.87% YTD.
The S&P 500 Information Technology is the leading sector so far this month, +5.54% MTD and +12.48% YTD, while Energy is the weakest sector at -4.39% MTD and +26.61% YTD.
Over the past seven days, Communication Services outperformed within the S&P 500 at +5.80%, followed by Information Technology and Industrials at +4.87% and +4.12%, respectively. Conversely, Energy underperformed at -3.62%, followed by Financials and Utilities at -0.19% and +0.04%, respectively.
The equal-weight version of the S&P 500 was +0.83% on Wednesday, underperforming its cap-weighted counterpart by 0.63 percentage points.
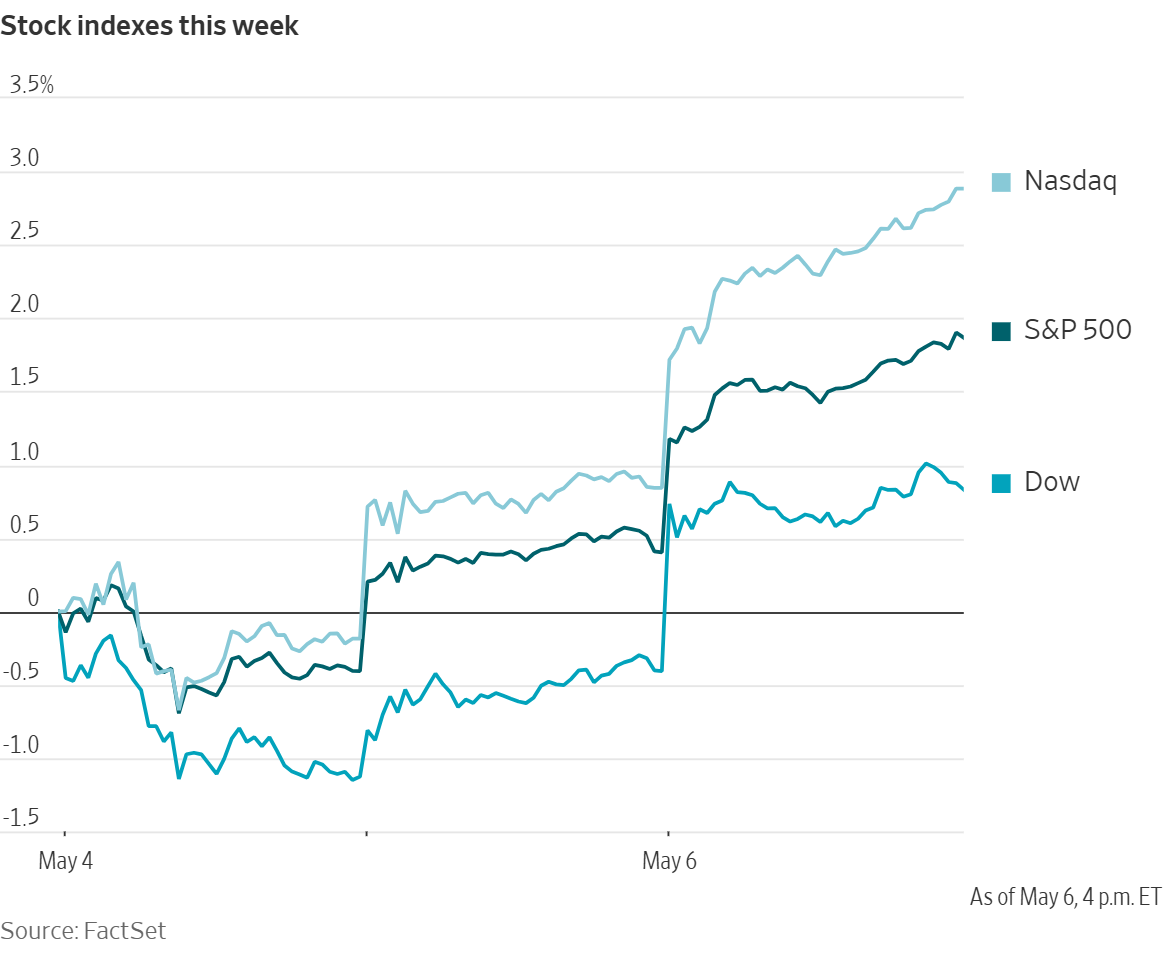
On Wednesday, the Dow Jones Industrial Average was +1.24%, or 612.34 points, to close at 49,910.59. The S&P 500 was +1.46%, or 105.90 points, to 7,365.12. The Nasdaq Composite rose +2.02%, or 512.82 points, to 25,838.94. Over the past seven days, the S&P 500 is up +3.21%, the Dow Jones +0.89% and the Nasdaq Composite +4.72%.
In corporate news, shares of Samsung experienced a significant rally, propelled by robust demand for AI chips, which resulted in the company joining the exclusive group of firms valued at over one trillion dollars.
Nvidia acquired $500 million worth of rights to shares in Corning, a leading manufacturer of fiber-optic cables. This transaction forms part of a broader strategic partnership between the two companies, aimed at enhancing and expanding AI infrastructure.
Anthropic PBC has entered into an agreement with SpaceX to strengthen its computing capabilities and accommodate the increasing demand for its Claude AI software.
Eli Lilly & Co’s diabetes drug, Mounjaro, has surpassed Merck & Co’s Keytruda cancer therapy to become the world’s top-selling medication.
Walt Disney reported Q1 results exceeding Wall Street expectations, driven by improved profitability in its streaming segment, the release of new Avatar and Zootopia films and increased spending by guests at its resorts and on cruises.
Mega caps: The Magnificent Seven had a mixed performance over the past week. Over the last seven days, Alphabet +13.75%, Tesla +6.96%, Apple +6.42% and Amazon +4.54%, while Nvidia -0.68%, Microsoft -2.47% and Meta Platforms -8.41%.
Energy stocks had a negative performance this week. The Energy sector itself was -3.62%. WTI and Brent prices are -11.32% and -15.08%, respectively, over the past week. Over the last seven days, Energy Fuels +19.58% and Marathon Petroleum +1.64%, while Phillips 66 -1.02%, Shell -2.09%, Baker Hughes -3.11%, Halliburton -3.37%, Chevron -3.67%, ExxonMobil -3.87%, BP -4.27%, APA -5.01%, ConocoPhillips -7.29% and Occidental Petroleum -9.28%.
Materials and Mining stocks had a mostly positive performance this week, with the Materials sector itself +2.71%. Over the past seven days, Sibanye Stillwater +15.57%, Newmont Corporation +6.96%, Freeport-McMoRan +6.96%, Nucor +5.32%, Mosaic +2.30% and Albemarle +0.91%, while Yara International -0.49%, Celanese Corporation -4.56% and CF Industries -5.54%.
European Stock Indices Price Performance
Stoxx 600 +1.96% MTD and +5.24% YTD
DAX +2.58% MTD and +1.75% YTD
CAC 40 +2.27% MTD and +1.84% YTD
IBEX 35 +1.82% MTD and +4.60% YTD
FTSE MIB +0.65% MTD and +8.04% YTD
FTSE 100 +0.58% MTD and +5.11% YTD
This week, the pan-European Stoxx Europe 600 index is +3.37%. It was +2.22% on Wednesday, closing at 623.25.
So far this month Basic Resources in the STOXX Europe 600 is the leading sector +4.87% MTD and +24.02% YTD, while Oil & Gas is the weakest at -2.33% MTD and +33.95% YTD.
Over the past seven days, Basic Resources outperformed within the STOXX Europe 600, at +6.98%, followed by Industrial Goods & Services and Construction & Materials at +6.31% and +5.69%, respectively. Conversely, Oil & Gas underperformed at -0.55%, followed by Utilities and Chemicals at +0.42% and +0.55%, respectively.
Germany's DAX index was +2.12% on Wednesday, closing at 24,918.69. It is +4.02% over the past seven days. France's CAC 40 index was +2.47% Wednesday, closing at 18,104.30. It is +2.62% over the past week.
The UK's FTSE 100 index was +0.06% over the past week to 10,219.11. It was -1.40% on Wednesday.
Autos & Parts emerged as the best-performing sector, buoyed by relief that de-escalating tensions in the Middle East can alleviate supply-chain and energy-cost pressures. BMW advanced even though its Q1 pre-tax earnings dropped 25%; the results still surpassed forecasts despite China weakness and tariff headwinds, auto margins came in at a solid 5%. Continental shares rose after posting a beat on EBIT, with Tire margins reaching 14.4% and a notable improvement in ContiTech.
Travel & Leisure traded higher as declining oil prices, jet fuel’s largest expense, provided immediate margin relief. Deutsche Lufthansa advanced after narrowing its Q1 adjusted EBIT loss to -€612 million, outperforming estimates. The airline reaffirmed its full-year guidance despite facing €1.7 billion in higher fuel costs due to Middle East tensions, with plans to mitigate these through pricing and capacity adjustments. Strong pent-up demand was noted, even as strikes threaten operations. Airbus drew focus with news of an impending order of approximately 150 A220 aircraft from AirAsia.
Basic Resources was supported by easing bond yields, a shift towards riskier assets and lower energy costs. Construction & Materials was similarly supported, as well as earnings support from Heidelberg Materials, after its Q1 EBIT of €163 million met expectations; the company reaffirmed its full-year outlook despite higher energy expenses from the Middle East conflict, planning to offset these with surcharges and price increases. Skanska shares were also higher after securing a $1 billion bridge contract in Massachusetts.
Oil & Gas underperformed, with crude prices dropping amid renewed hopes for a peace deal with Tehran. Equinor declined even after exceeding Q1 EPS expectations, reporting $1.48 EPS compared to the $1.01 EPS estimate, and announcing the next phase of its share buyback program. Shell traded lower ahead of its quarterly report due Thursday. TotalEnergies declined despite reports of Daniel Kretinsky’s interest in increasing his stake. Utilities weakened as well, affected by increased risk-taking in the market.
Food & Beverage underperformed as risk-on sentiment led to outflows from defensive sectors. The spotlight was on Diageo, which surprised with organic sales growth in Europe and Latin America offsetting soft US performance; it maintained its 2026 guidance, but warned that the Middle East conflict could still disrupt supply chains. Health Care also traded lower in this rotation, though Novo Nordisk was a standout exception after its Q1 profit declined less than anticipated and the company raised its full-year guidance on robust Wegovy pill sales, with GLP-1 obesity treatments sales exceeding expectations.
Other Global Stock Indices Price Performance
MSCI World Index +2.00% MTD and +7.30% YTD
Hang Seng +3.16% MTD and +3.74% YTD
Over the past seven days, the MSCI World Index and Hang Seng Index are +3.19% and +1.73%, respectively.
Currencies
EUR +0.13% MTD and +0.01% YTD to $1.1746
GBP -0.12% MTD and +0.85% YTD to $1.3587
The US dollar declined broadly on Wednesday, while a sudden surge in the Japanese yen to its highest level in over two months heightened market vigilance for potential renewed intervention by Japanese authorities.
The dollar index fell by -0.49% to 98.01, after touching a low of 97.62, its weakest level since prior to the US-Israeli strikes on Iran on 28 February that initiated the current conflict. Over the past week, the dollar index is down -0.95%.
The euro appreciated +0.48% to $1.1746, contributing to an increase of +0.63% over the past week. The British pound traded +0.39% higher to $1.3587. Over the past week, the pound has risen +0.85% against the US dollar.
Market participants are now turning their attention to the upcoming US non-farm payrolls report on Friday, which will be a key indicator of whether the economy remains robust enough to justify maintaining the Fed’s current monetary policy stance, or if signs of labour market weakness might renew discussions around potential monetary easing.
The dollar declined -1.01% to ¥156.25, after reaching a low of ¥155, its weakest point since 24 February. This movement has fuelled speculation of another possible intervention in the currency markets.
Earlier this week, Japanese Finance Minister Satsuki Katayama cautioned against speculative trading in the foreign exchange markets, following a brief rally in the yen that sparked renewed conjecture regarding official intervention by Tokyo to bolster the currency. Over the past week, the yen has advanced +2.56% against the US dollar. However, the yen is down -0.19% MTD and -0.26% YTD.
Note: As of 5:00 pm EDT 6 May 2026
Cryptocurrencies
Bitcoin +6.95% MTD and -7.03% YTD to $81,526.46
Ethereum +4.33% MTD and -20.99% YTD to $2,353.46
Bitcoin was +7.60% over the last seven days and Ethereum was +4.81%. On Wednesday, Bitcoin was +0.14% and Ethereum -0.92%. Cryptocurrencies have advanced this week as lower oil prices resulting from an increase in optimism around around the US - Iran cease-fire, has removed inflation pressures that had weighed on risk assets, creating room for capital rotation back into cryptocurrencies, although investors remain heavily concentrated in Bitcoin as the sector’s most liquid and established asset. In addition, US Spot Bitcoin ETFs continue to see sustained institutional inflows. April 2026 was the strongest month of inflows so far this year, with total net inflows of $1.97 billion.
In a move that should be supportive to crypto, executive director of the President's Council of Advisors for Digital Assets, Patrick Witt, has set a target date for 4 July to pass broad crypto legislation into law. He also told the audience at CoinDesk's Consensus Miami 2026 on Wednesday that an announcement on the reserve is coming "in the next few weeks."
Note: As of 5:00 pm EDT 6 May 2026
Fixed Income
US 10-year yield -2.4 bps MTD and +17.9 bps YTD to 4.351%
German 10-year yield -3.6 bps MTD and +14.5 bps YTD to 3.005%
UK 10-year yield -7.5 bps MTD and +47.0 bps YTD to 4.948%
US Treasury yields declined across all maturities on Wednesday, reflecting shifting sentiment in the fixed income markets.
The yield on the US 10-year Treasury note decreased by -7.8 bps to 4.351%, after reaching a session low of 4.334%, its lowest level since 27 April.
The yield on the 30-year bond declined by -5.1 bps to 4.938%. Earlier in the week, the 30-year yield had reached 5.036% on Monday, marking its highest point since 17 July.
The two-year US Treasury yield, which is often responsive to Fed fund rate expectations, declined by -8.0 bps to 3.870%, registering its most significant daily drop since 17 April.
On Wednesday, the US Treasury Department announced a total quarterly refunding of $125 billion for the period from May to July. This initiative is designed to raise $41.7 billion in new cash from private investors, with coupon and floating rate note auction sizes set to remain unchanged for at least the next several quarters. This decision avoided signalling potential coupon increases as early as this year, a development some market participants had anticipated.
The US Treasury yield curve, measured by the spread between yields on two- and 10-year Treasury notes, stood at 48.1 bps, 1.2 bps wider than the previous week’s 46.9 bps.
At the front-end, the 2-year yield was -9.5 bps lower over the past seven days, the 10-year yield declined by -8.3 bps, and at the longer end, the 30-year yield decreased by -6.8 bps.
According to CME Group's FedWatch Tool, Fed funds futures traders are now pricing in a 6.5% probability of a 25 bps rate cut at June’s FOMC meeting, compared to 1.0% from last week. Fed funds futures traders are pricing in 2.1 bps of rate hikes in 2026, lower than the 2.3 bps of rate hikes priced in a week ago.
Across the Atlantic, in the UK, on Wednesday the 10-year gilt declined by -11.6 bps to 4.948%. Over the past seven days, it has decreased by -15.3 bps.
Eurozone government bond yields experienced a notable decline on Wednesday, as investors reduced their expectations for ECB rate hikes, encouraged by optimism surrounding a potential US – Iran peace agreement.
Germany's two-year yields, sensitive to shifts in policy rate outlooks, fell -11.2 bps to 2.579%. The 10-year German yield decreased -5.9 bps to 3.005%, after having reached 3.133% last week, its highest level since 2011. At the long-end of the German curve, the 30-year yield declined -3.6 bps to 3.543%.
According to the ECB's wage tracker released on Wednesday, trends in negotiated wage growth across the eurozone have remained largely unchanged since the onset of the Iran conflict.
Money markets priced the ECB's deposit rate at 2.67% for December, down from approximately 2.70% earlier in the session. The current deposit rate stands at 2.0%, and markets are assigning about a 70% probability of a first rate hike occurring next month.
During the past week, the German yield curve bull-steepened as short-term yields fell faster than long-term yields. Over the course of the past seven days, the two-year Schatz yield traded -17.3 bps lower, while yield on the 10-year bund declined by -10.6 bps. At the longer end of the spectrum, the 30-year German yield fell -4.6 bps.
Money markets currently assign probability to an ECB rate increase in June, while three 25 bps hikes by year-end are almost fully priced in.
Italy's 10-year BTP yield declined -13.2 bps to 3.739%, with the spread over safe-haven Bunds narrowing by 9.6 bps, to 73.4 bps from 83.0 bps the previous week. The Italian 10-year yield declined -20.2 bps throughout the week.
The yield spread between German Bunds and 10-year UK gilts reached 194.3 bps on Wednesday, a decrease of 4.7 bps over the past seven days.
The spread between US 10-year Treasuries and German Bunds is now 134.6 bps, an increase of 2.3 bps from last week’s 132.3 bps.
Over the course of the week, France’s 10-year OAT yield fell -14.8 bps. The spread between the French OAT 10-year yield and the German Bund 10-year yield stood at 61.3 bps, 4.2 bps lower than last week’s 65.5 bps.
Commodities
Gold spot +1.46% MTD and +8.69% YTD to $4,689.05 per ounce
Silver spot +4.88% MTD and +8.52% YTD to $77.33 per ounce
West Texas Intermediate crude -8.73% MTD and +67.58% YTD to $96.21 a barrel
Brent crude -10.59% MTD and +67.48% YTD to $102.01 a barrel
On Wednesday, gold prices reached their highest level in over a week. Spot gold climbed +2.92% to end the session at $4,689.05 per ounce, after earlier reaching its highest level since 27 April. Over the past week, gold prices rose +3.28%.
The US dollar index declined by -0.49% to 98.01, thereby increasing the affordability of dollar-denominated metals for investors holding other currencies.
Spot silver also advanced, rising +6.91% to $77.33 per ounce. Over the past week, silver prices increased +8.18%.
Both WTI and Brent crude oil prices closed down more than six percent following reports that the US and Iran have made significant progress toward an understanding that could facilitate further negotiations and potentially bring an end to the ongoing conflict.
Brent crude futures declined by $8.49, or -7.68%, to $102.02 per barrel. WTI futures decreased by $6.46, or -6.29%, to settle at $96.21 per barrel. Over the past week, WTI is -11.32% and Brent is -15.08%.
According to a report published by Axios on Wednesday morning, the White House believes it is nearing an agreement with Iran on a one-page Memorandum of Understanding (MOU) intended to conclude the war and establish a framework for more detailed nuclear discussions. The US anticipates Iranian responses on several critical issues within the next 48 hours.
By midday Wednesday, additional reports suggested that both parties are indeed negotiating an MOU that would pave the way for a month-long dialogue period aimed at ending the war. During these 30 days, Iran would relax its control over the Strait of Hormuz, while the US would ease its blockade. Key areas of dispute include uranium enrichment, the removal of uranium from Iranian territory and Tehran’s insistence on maintaining some degree of authority over the Strait of Hormuz.
France has deployed a carrier strike group to the Red Sea in anticipation of a possible mission to secure maritime traffic through the Strait of Hormuz. Meanwhile, Iran has requested that the UN reject a US-backed resolution to open the strait.
Regarding global oil supply and stockpiles, Rystad estimates that the world has lost approximately 600 million barrels of oil supply, with losses potentially rising to between 1.2 and 2.0 billion barrels by the time supply returns to normal, assuming shipping returns to standard levels by the end of this month.
Some analysts expect European reserves to reach minimum levels within the month, and similar conditions may occur in the US by 4 July or even earlier. Product stockpiles at the port of Fujairah have fallen to historic lows. According to the Bloomberg news OPEC production survey, April oil output dropped to a 36-year low of 20.55 million barrels per day, representing a m/o/m decrease of 420,000 barrels, following an 8.6 million barrel decline in March.
EIA report. The latest US Energy Information Agency (EIA) report, released on Wednesday, showed that US crude oil refinery inputs averaged 16.0 million barrels per day during the week ending 1 May 2026, which was 42 thousand barrels per day less than the previous week’s average. Refineries operated at 90.1% of their operable capacity last week. Gasoline production decreased last week, averaging 9.6 million barrels per day. Distillate fuel production decreased, averaging 4.9 million barrels per day.
US crude oil imports averaged 5.5 million barrels per day last week, but were down by 273 thousand barrels per day from the previous week. Over the past four weeks, crude oil imports averaged about 5.6 million barrels per day, 2.4% less than the same four-week period last year. Total motor gasoline imports averaged 755 thousand barrels per day last week, and distillate fuel imports averaged 123 thousand barrels per day.
US commercial crude oil inventories fell by 2.3 million barrels from the previous week. At 457.2 million barrels, US crude oil inventories are about 1% above the five-year average for this time of year. Total motor gasoline inventories declined by 2.5 million barrels from last week and are 4% below the five-year average for this time of year. Finished gasoline inventories increased, while blending component inventories decreased last week.
Distillate fuel inventories decreased by 1.3 million barrels last week and are about 11% below the five-year average for this time of year. Total commercial petroleum inventories decreased by 5.9 million barrels last week. Total products supplied over the last four-week period averaged 20.3 million barrels per day, up by 2.6% from the same period last year. Over the past four weeks, motor gasoline product supplied averaged 9.0 million barrels per day. This is up by 1.0% from the same period last year. Distillate fuel product supplied averaged 3.8 million barrels per day over the past four weeks, up by 3.5% from the same period last year. Jet fuel product supplied was down 6.2% compared with the same four-week period last year.
Note: As of 5:00 pm EDT 6 May 2026
Key data to move markets
EUROPE
Thursday: German Factory Orders, Eurozone Retail Sales and speeches by ECB Vice President Luis de Guindos, ECB Executive Board members Frank Elderson and Isabel Schnabel and ECB Chief Economist Philip Lane
Friday: German Industrial Production and speeches by ECB Vice President Luis de Guindos, ECB President Christine Lagarde, ECB Executive Board member Piero Cipollone, ECB Executive Board member Isabel Schnabel and German Bundesbank President Joachim Nagel
Sunday: A speech by ECB Executive Board member Piero Cipollone
Tuesday: German Harmonised Index of Consumer Prices, German ZEW Current Economic Situation and Economic Sentiment Surveys and Eurozone Economic Sentiment Survey
Wednesday: Eurozone Employment Change, GDP and Industrial Production
UK
Tuesday: BRC Like-for-Like Retail Sales
Wednesday: A speech by BoE MPC member Catherine Mann
USA
Thursday: Initial and Continuing Jobless Claims, Nonfarm Productivity, Unit Labour Costs and speeches by Minneapolis Fed President Neel Kashkari, Cleveland Fed President Beth Hammack and New York Fed President John Williams
Friday: Nonfarm Payrolls, Average Hourly Earnings, Unemployment Rate, Labour Force Participation Rate, U6 Underemployment Rate, Michigan Consumer Expectations Index, Michigan Consumer Sentiment Index, UoM 1 and 5-year Inflation Expectations and a speech by Fed Governor Lisa Cook
Saturday: Speeches by Fed Vice Chair for Supervision Michelle Bowman, San Francisco Fed President Mary Daly, Chicago Fed President Austan Goolsbee and Fed Governor Christopher Waller
Monday: Existing Home Sales
Tuesday: CPI, Monthly Budget Statement and speeches by New York Fed President John Williams and Chicago Fed President Austan Goolsbee
Wednesday: PPI and a speech by Minneapolis Fed President Neel Kashkari
JAPAN
Thursday: Labour Cash Earnings and Bank of Japan Monetary Policy Meeting Minutes
Wednesday: Current Account
CHINA
Saturday: Exports, Imports and Trade Balance
Monday: CPI and PPI
While every effort has been made to verify the accuracy of this information, EXT Ltd. (hereafter known as “EXANTE”) cannot accept any responsibility or liability for reliance by any person on this publication or any of the information, opinions, or conclusions contained in this publication. The findings and views expressed in this publication do not necessarily reflect the views of EXANTE. Any action taken upon the information contained in this publication is strictly at your own risk. EXANTE will not be liable for any loss or damage in connection with this publication.
هذه المقالة متاحة لأغراض معلوماتية فقط، ولا ينبغي اعتبارها عرضًا أو التماسًا لعرض شراء أو بيع أي استثمارات أو خدمات ذات صلة يمكن الإشارة إليها هنا. ينطوي التداول في الأدوات المالية على مخاطر كبيرة من الخسارة وقد لا يكون مناسبًا لجميع المستثمرين. الأداء السابق ليس مؤشرًا موثوقًا به للأداء المستقبلي.


أنشأها المتخصصون. للمحترفين.
