
EXANTE Quarterly Macro Insights Q2 2025

Q2 review
It turned out to be a great quarter for US equity markets while US bonds remained rangebound and were outperformed by their European and Japanese counterparts. The S&P 500 and Nasdaq 100 ended Q2 at new all-time highs while US dollar weakness helped boost non-US returns. For the second quarter in a row, non-US stocks outperformed. The S&P 500 recovered from the April lows that were induced by President Trump’s ‘liberation day’ tariffs, after the market’s reaction essentially forced him to announce a ‘pause’, allowing time for negotiations. The S&P 500 ended up almost 5% in Q2. As noted by Nasdaq research, after a 6.3% total return in May, the S&P 500 rose 5.1% in June for its first consecutive monthly gains since September 2024. Its 11.7% total return for May and June was the best two month return since December 2023. The VIX declined from a peak of 50 back down to the teens. And, although tariff uncertainty was mentioned in a number of Q1 corporate earnings results and outlook statements, the S&P 500 still recorded an average earnings growth of 13%. Despite January’s fears that DeepSeek would undermine US technology stocks, AI stocks continued to rise as companies continued to invest in AI to improve efficiency, with Nvidia alone rising almost 17% over Q2. It was a mixed quarter for bonds with shorter-term Treasury bond yields declining as bets increased that the Federal Reserve would begin cutting rates again in September. However, longer-term rates continued to increase.
Although the 9 July deadline is fast approaching and tariff negotiations are still ongoing, we have yet to clearly see how the cost of tariffs is going to be distributed between exporters to the US and the end consumers and the impact on the wider US economy. However, the US dollar continued to decline in Q2, with it now having had its worst start to the year since 1973 and the worst six month performance since 2009. As noted by JPMorgan, this boosted the returns of international indices for dollar investors as the value of returns generated in other currencies increased over the quarter. The decline can be attributed to tariff and fiscal policy uncertainties along with rising expectations of Fed rate cuts as the economy continues to show some signs of weakening causing investors to reduce their exposure to the dollar and US assets with the euro and euro assets being the prime beneficiaries.
The big issues now are whether there will be agreement on tariffs, if the Senate will pass President Trump’s “big, beautiful” tax and spending bill without further amendments, if the ceasefire will continue to hold between Iran and Israel and the strait of Hormuz remains untouched, if OPEC+ will continue to raise output, and if inflation will continue its steady decline.
US Indices for Q2 2025 and YTD
S&P 500 +4.96% Q2 and +5.50% YTD
Nasdaq 100 +6.27% Q2 and +7.93% YTD
Dow Jones Industrial Average +4.32% Q2 and +6.57% YTD
NYSE +3.26% Q2 and +6.98% YTD
According to the S&P Sector and Industry Indices, 9 of the 11 S&P 500 sectors were up in Q2. The best performing sector in Q2 2025 was Information Technology at +9.73%, followed by Communication Services at +7.18%, and Energy at +4.74%, whereas Consumer Staples was -2.21%, and Real Estate -0.49%.
It was a mostly positive Q2 for the Magnificent Seven: Nvidia +16.92%, Meta Platforms +13.99%, Microsoft +8.05%, Amazon +7.01%, Alphabet +2.61%, and Apple +2.15%, while Tesla -8.31%.
In Q2 Energy stocks were +4.74% due to escalating tensions in the Middle East that exacerbated concerns about potential supply disruptions. Chevron +4.75%, Shell +4.25%, BP Plc +1.65%, ExxonMobil +5.38%, Phillips 66 +5.13%, Baker Hughes +3.48%, Marathon Petroleum +3.34%, Halliburton +4.03%, and Occidental Petroleum +3.02%.
Basic materials stocks were +2.09% in Q2. Performance was broadly positive with Nucor Corporation +18.45%, Sibanye Stillwater +17.65%, Freeport-McMoRan +12.66%, Albemarle Corporation +12.39%, Newmont Mining +10.51%, Yara International +1.64%, CF Industries Holdings +1.42%, and Mosaic +0.94%.
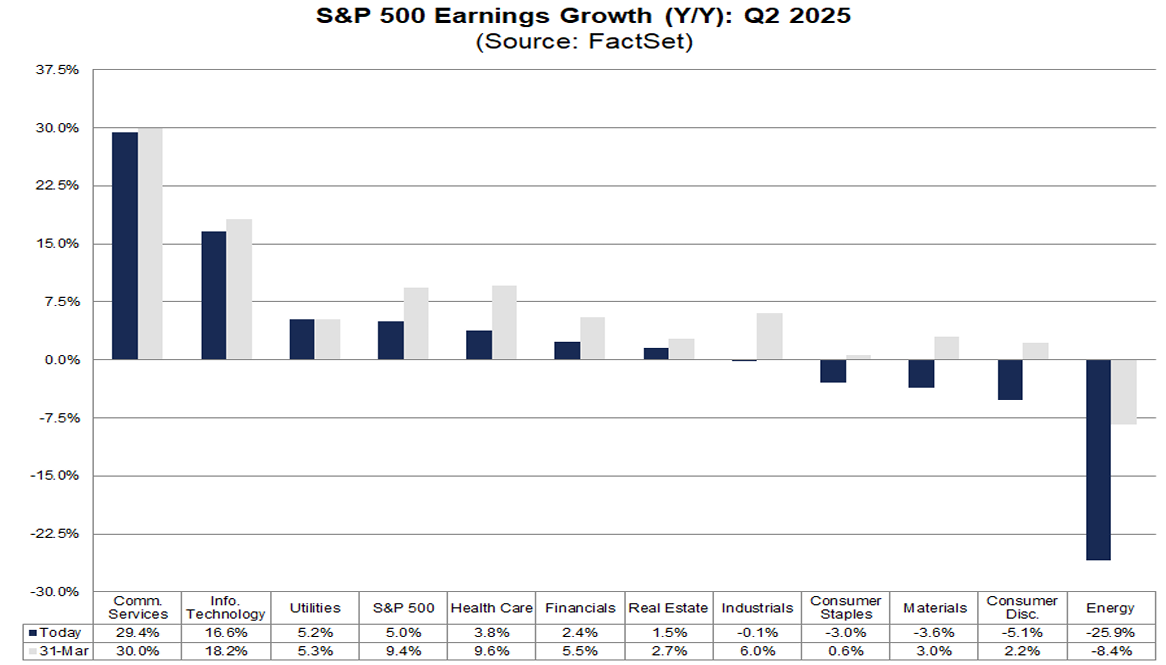
For Q2 2025, the estimated y/o/y earnings growth rate is 5.0%. The proportion of S&P 500 companies issuing negative EPS guidance is below historical averages. Of the 110 companies in the index that have provided guidance for Q2 2025 to date, 59 have issued negative EPS guidance, while 51 have issued positive guidance. The resulting rate of 53.6% for negative guidance is lower than both the 5-year average of 57.0% and the 10-year average of 61.0%.
The estimated net profit margin for the S&P 500 in Q2 2025 is 12.3%. While lower than Q1’s 12.7%, it remains slightly above the year-ago margin of 12.2% and the 5-year average of 11.7%.
Sector-specific analysis indicates that two sectors are projected to see a y/o/y increase in their net profit margins for Q2 2025 compared to the same period in 2024. Communication Services is expected to lead this growth with a 2.4 percentage point rise, moving from 11.6% to 14.0%.
Conversely, nine sectors are anticipated to report y/o/y declines in their net profit margins. Energy is projected to lead these declines with a 1.6 percentage point decrease, falling from 9.1% to 7.5%.
Five sectors are anticipated to report net profit margins for Q2 2025 that exceed their 5-year averages. Industrials are expected to demonstrate the most significant increase, with a 2.2 percentage point difference, reaching 10.7% in Q2 2025 compared to its 5-year average of 8.5%.
Conversely, six sectors are projected to report Q2 2025 net profit margins below their respective 5-year averages. Energy is the most notable in this group, with an anticipated decrease of 2.1 percentage points, from 9.6% to 7.5%.
European Indices Q2 2025
Stoxx 600 -1.33% Q2 and +6.55% YTD
DAX -0.37% Q2 and +20.09% YTD
CAC 40 -1.11% Q2 and +3.86% YTD
IBEX 35 -1.13% Q2 and +20.67% YTD
FTSE MIB -0.74% Q2 and +16.40% YTD
FTSE 100 -0.13% Q2 and +7.19% YTD
As of 1st July, according to LSEG I/B/E/S data for the STOXX 600, Q2 2025 earnings are expected to increase 0.6% from Q2 2024. Excluding the Energy sector, earnings are expected to increase 2.4%. Q2 2025 revenue is expected to decrease 2.2% from Q2 2024. Excluding the Energy sector, revenues are expected to increase 0.0%. Two companies in the STOXX 600 have reported earnings to date for Q2 2025. Of these, 50.0% reported results exceeding analyst estimates. In a typical quarter 54% beat analyst EPS estimates. Two companies in the STOXX 600 have reported revenue to date for Q2 2025. Of these, 50.0% reported revenue exceeding analyst estimates. In a typical quarter 58% beat analyst revenue estimates.
The STOXX 600 expects to see shareweighted earnings of €123.3 bn in Q2 2025, compared to share-weighted earnings of €122.6 bn (based on the year-ago earnings of the current constituents) in Q2 2024.
Four of the ten sectors in the index expect to see an improvement in earnings relative to Q2 2024. The Technology sector has the highest earnings growth rate (23.4%) for the quarter, while the Consumer Cyclicals has the weakest anticipated growth (-25.1%) curompared to Q2 2024.
The forward four-quarter price-to-earnings ratio (P/E) for the STOXX 600 sits at 14.1x, below the 10-year average of 14.3x.
During the week of 7th July, 12 companies are expected to report quarterly earnings.
Analysts expect positive Q2 earnings growth from eight of the sixteen countries represented in the STOXX 600 index. Ireland (85.4%) and Poland (67.2%) have the highest estimated earnings growth rates, while Norway (-9,3%) and Austria (-7.3%) have the lowest estimated growth.
Global Indices for Q2 and YTD
Hang Seng +3.36% Q2 and +20.00% YTD
MSCI World +9.01% Q2 and +5.73% YTD
Fixed Income for Q2 and YTD
US Treasuries 10-year yield +1.8 bps Q2 and -34.8 bps YTD to 4.228%.
Germany’s 10-year yield -14.1 bps Q2 to and +23.8 bps YTD to 2.607%.
Great Britain’s 10-year yield -20.1 bps Q2 to and -8.0 bps YTD to 4.488%.
Q2 saw increasing volatility for US bonds due to growing concerns around US fiscal policy and debt sustainability as bond markets focused on the implications of the “big, beautiful tax bill”, which could add between $3 and $5 trillion to US Federal debt over the next 10 years. This caused longer dated bond yields to rise with the US 30-year bond yields rising 20 bps over the quarter. The Fed itself has remained on pause since January with the target range for the federal funds rate remaining at 4.25% to 4.5%. The yields on the 10-year Treasury note ended Q2 at 4.23% after climbing as high as 4.58% in May. Yields steepened throughout the quarter with the yield on the 30-year Treasury note soaring above 5.00% in May before falling back to 4.79%. By the end of Q2 the spread between the 10-year and two-year Treasury yields was 0.56 percentage points, compared with 0.34 percentage points at the end of the first quarter. The Fed's latest economic projections show slower growth by year-end. Officials still expect to cut borrowing costs twice this year, according to their latest economic projections. The FOMC is also concerned about the impact of tariff policies on US growth and inflation. Fed chair Jerome Powell has admitted that the Fed would have cut rates already if not for the tariffs.
Across the Atlantic, European government bonds outperformed their US counterparts over the quarter. The 10-year German Bund yield decreased by 14.1 basis points, closing at 2.607%. With the ECB's policy rate now widely considered neutral, the 10-year yield is likely to reflect this by trading in narrower ranges going forward. While a sudden risk-off shock would undoubtedly fuel volatility, the eurozone economy is currently on a more stable footing, with Germany's fiscal policy poised for significant expansion and European defence spending expected to increase in general. However, the actual execution of these spending plans will depend on the commitment of these governments to the 5% target given other country specific domestic political demands and the defence sector’s capacity to meet increased demand.
Despite Germany's ample capacity for fiscal loosening, the impact on yields has been modest, with the 10-year Bund yield primarily trading within a 2.400% to 2.600% range. This range is consistent with levels seen in January and February, prior to the German fiscal announcement that saw the 10-year yield surpass the 2.80% level in March.
It’s likely that low inflation will counteract any upward pressures on yields stemming from fiscal expansion. The negotiated wage annual growth tracker for the eurozone has sharply declined from over 5% at the end of last year, now signalling a year-end rate for this year of just 1.425%. Furthermore, the extent of the euro's appreciation will contribute to disinflationary pressures, which will help limit upward yield pressures associated with fiscal expansion.
Commodities in Q2 and YTD
Gold spot +3.86% Q2 and +27.15% YTD to $3,302.42 an ounce.
Silver spot +5.64% Q2 and +26.29% YTD to $36.08 an ounce.
West Texas Intermediate crude -8.91% Q2 and -8.74% YTD to $64.89 a barrel.
Brent crude -9.54% Q2 and -10.09% YTD to $67.63 a barrel.
While recent gains have consolidated, gold prices have surged by +27.15% year-to-date. This appreciation is primarily attributable to structurally higher demand from central banks, whose gold purchases have increased five-fold since 2022, following the freezing of Russia's central bank reserves. A May survey conducted by Goldman Sachs, encompassing over 70 central banks globally, revealed record-high purchase intentions, with no surveyed central bank indicating a plan to reduce its gold holdings over the next 12 months.
Furthermore, gold stands as a significant potential beneficiary of continued dollar diversification. For months, gold has spearheaded this trend, driven by a potent combination of rising fiscal debt concerns, tariff-induced supply shocks, a softening labour market, and persistent US dollar weakness. These developments may ultimately prompt a more dovish, and potentially stronger-than-expected, policy shift from the Fed. Compounding these factors is the risk of higher inflation and the prospect of central banks extending their gold-buying spree into a fourth consecutive year.
The escalation in tensions between the US and Iran during June has reignited geopolitical risk within EM. US airstrikes on Iranian nuclear sites were met with a conspicuously signalled, largely symbolic missile attack targeting Al Udeid Air Base in Qatar. While the Strait of Hormuz remains open, the credibility of future Iranian retaliation, though estimated to be low, persists as a market risk. Oil's price action demonstrated investor sensitivity even to symbolic strikes, as WTI prices declined by over seven percentage points on the relief that critical energy infrastructure remained unharmed.
Iran's response was designed to preserve its standing without escalating the conflict. Short- and medium-range ballistic missiles launched at the US base in Qatar resulted in no casualties, as Qatar's airspace had been closed in advance and the base evacuated. Press reports have corroborated that the number of missiles deployed mirrored the US bombs dropped on Fordow, Natanz, and Isfahan, signalling a deliberate proportionality. This orchestrated response allowed Tehran to project strength domestically without triggering broader US or Israeli retaliation. Oil markets interpreted this as a de-escalatory signal, with WTI falling below $70 intra-day after an initial spike following the headlines. Tehran appears to have recognised that the threshold for meaningful retaliation has been elevated.
Crucially, this episode may signify a turning point in regional perceptions, as the Trump administration may have successfully reestablished deterrent credibility. The strike campaign against nuclear sites, executed without hesitation and followed by clear warnings, appears to have recalibrated Iran's behaviour.
Investors’ attention remains focused on the Strait of Hormuz, the critical shipping chokepoint through which approximately 20% of the world's oil and gas transits. A sustained blockage of this strait could lead to a significant surge in oil prices. In such a scenario, natural gas supplies would also be affected, as Qatari and other Gulf liquefied natural gas LNG tankers must traverse the Strait before reaching destinations in Asia, Europe, and elsewhere.
The most probable scenario is that the crisis will introduce a persistent but moderate risk premium into prices, causing Brent crude to hover within a specific range as long as tensions continue to simmer. Despite the prevailing unrest in the Middle East, natural gas market fundamentals remain stable, supported by lower European storage targets and subdued Asian demand.
Note: Data as of 5 pm EDT 2 July 2025
Regional news
The USA
Core PCE inflation increased to 2.70% in May from 2.60% in April. In addition, consumer spending and income showed further signs of weakening. Spending fell 0.1% in May while personal income was down 0.4%.
With inflation remaining above target, even before the full impact of tariffs, the weak consumer spending data may allow the Fed to consider future rate cuts to mitigate the risk of a more significant economic downturn. Even though the Fed has pencilled in two rate cuts by the end of this year, the prevailing uncertainties in trade and fiscal policies means that the Fed, despite increasing pressure from the US President, is likely to continue to hold until at least September.
Q2 saw US equities initially face significant headwinds, with the S&P 500 experiencing a decline of almost 20%, marking its largest quarterly drop since Q3 2022. March proved particularly challenging, witnessing a 5.5% decrease, the most substantial monthly fall since December 2022. However, markets recovered with the equity markets ending Q2 at their highest levels ever.
The eurozone
The ECB continued its rate cuts in Q2 with inflation in June edging slightly up from May’s 1.9% to 2.0%. However, the ECB may go into pause mode during the July meeting as it waits to see the outcome of tariff negotiations. Nevertheless, markets are pricing in one more rate cut this year. The ECB has stated that it will stay attuned to upside risks that may develop from events in the Middle East as well as on the tariff front.
Performance across European equities was broadly negative in Q2. Spain's IBEX 35 was the weakest performer, declining by -1.13%, additionally, followed by France’s CAC 40 at -1.11%. UK’s FTSE MIB fell by -0.74% while FTSE 100 decreased by -0.13%. Germany's DAX index fell by -0.37%. In Q2, European equities underperformed their US counterparts, contrasting sharply with their Q1 outperformance, which had been the strongest in 20 years.
In Q2, sector performance exhibited a distinct bias towards the energy and technology sectors, as well as those that would benefit from increased government spending, and sectors that are less isolated to trade frictions. Sector-wise, Stoxx Euro 600’s top performers included Oil & Gas +3.90%, Technology +1.33%, Construction and Materials +1.32%, Industrial Goods & Services +1.20%, and Utilities +1.17%. Conversely, Food & Beverages -7.49%, Retail -4.64%, Chemicals -4.58%, Personal & Household Goods -4.40%, and Autos & Parts -4.31% lagged behind.
The Granolas in Q2: GSK -7.76%, Roche -5.21%, ASML +3.62%, Nestlé -10.11%, Novartis +2.28%, Novo Nordisk -3.10%, L'Oréal -2.50%, LVMH -7.04%, AstraZeneca -5.60%, Sanofi -6.07%, and SAP -2.91%.
The UK
After cutting rates by 25 bps in its May meeting, the Bank of England held rates at 4.25% at the June meeting with six members voting to leave rates unchanged and three voting for a 25 bps cut. The Bank’s statement said that it expects a significant slowing of pay growth over the rest of the year and it signalled a possible cut at its meeting in August due a weakening jobs market. It said it will remain sensitive to heightened unpredictability in the economic and geopolitical environment and will continue to update its assessment of risks to the economy. Traders are currently expecting 2 more rate cuts this year with the next expected during the August meeting.
The UK economy is showing some weakness. As noted by the UK Parliament’s House of Commons Library, GDP in April fell by 0.3% compared with the previous month, following growth of 0.2% in March and 0.5% in February. The decline in April was mostly a result of a 0.4% decline in the services sector, which accounts for around 80% of GDP. However, the S&P Global final Composite PMI for the UK came in at 52, above the 50.7 preliminary reading, up from 50.3 in May. The revision was driven by an increase in the final services sector PMI, to 52.8 from an initial 51.3, reflecting the fastest growth in 10 months. According to Tim Moore, Economics Director at S&P Global Market Intelligence, "June data highlighted a modest rebound in UK service sector growth, fuelled by a turnaround in domestic business and consumer spending after a soft patch during the spring. Business activity expansion was slightly stronger than the earlier 'flash' estimate. However, he also noted that employment numbers decreased for the ninth month running and at a faster pace than in May.
Nevertheless, consumer confidence was slightly up in June with the GfK Consumer Confidence Index rising by 2 points to -18, marking a gradual rebound from May's -20 and April's -23. This was driven by improvements in how consumers see the general economy, with scores up three points (looking at last year) and up by five points (looking at the next 12 months).
As noted by JPMorgan Asset Management, the UK faced headwinds from high exposure to the energy and healthcare sectors, which were the only negative equity sectors at a global level over the quarter. Despite this, the FTSE All-Share still delivered healthy returns of 4.4%.
However, with the government having to backtrack on another policy, their initially proposed £5 bn of welfare cuts, UK Chancellor Rachel Reeves, if she is unable or unwilling to pare back spending plans, may be forced to seek other sources of revenue. As noted by Bloomberg news, the UK government now faces a potential budget hole of £8 billion to £22 billion due to policy reversals, slow growth, weak tax receipts, and higher spending demands. UK gilts slumped following the welfare cut reversal, pushing the 10-year yield up by almost 16 bps.
Asia ex-Japan
During Q2 the falling US dollar was a tailwind to Asian growth. The temporary trade agreement between China and the US helped ease trade tensions, allowing Asian equities to deliver local currency returns of almost 9%. MSCI Asia-ex Japan was +12.7% in Q2. Hong Kong’s Hang Seng rallied over 3% thanks to this improved China sentiment. In addition, the appreciation of the Taiwanese dollar and the Korean won, which rose by 8.3% and 12.1% respectively against the US dollar, helped boost USD denominated returns further. Singapore’s MSCI Index rose 12.29% and Indonesia gained 20.4%.
Currencies
The US dollar had a volatile Q2, with the US Dollar Index ending the quarter down -7.04%. This may be attributable to concerns over fiscal policy and debt sustainability, tariff impacts, weakening employment, a falling housing market and lower -than-expected inflation boosting expectations for rate cuts.
In contrast, the euro experienced a rise throughout Q2 and ended at its highest level since 2021. It was +8.98% against the USD during Q2, while the GBP was +6.32% in Q2. The Japanese Yen -3.95% against the US dollar in Q2.
Following a period of strength early this year, the dollar has continued to come under pressure due to three primary factors: Firstly, trade tariffs have emerged as a dominant market theme, generating significant volatility and focussing investor attention on the potential adverse impacts of import duties on the US economy. Secondly, the release of softer US economic data has fuelled market expectations about a potential economic slowdown or even the onset of stagflation. Thirdly, debt levels and debt sustainability given the proposed ‘big, beautiful bill’ as it stands has raised concerns of US asset dominance on investors’ portfolios.
Following a period of consolidation in May, the euro demonstrated further strength in June, reaching a high against the US dollar not seen since September 2021, a point preceding Russia's invasion of Ukraine that instigated a substantial depreciation.
The euro emerged as the top-performing G10 currency in June, bolstered by several developments that reinforced investor confidence in Europe's capacity to manage additional currency appreciation. Economic data released in June underscored this optimism: the German IFO Business Climate Index, the Composite PMI, and the ZEW Expectations index all registered increases. This surge in sentiment is linked to Germany's planned fiscal expansion, which is set to significantly boost both infrastructure and defence spending.
At the June policy meeting, ECB President Lagarde reiterated her May comments regarding the opportunity for the euro to enhance its role as a reserve currency.
Looking ahead, the euro possesses the potential for continued appreciation against the US dollar over the medium term given the expected increase in defence spending across the vast majority of European NATO member states and, in Germany in particular.
The Japanese Yen experienced a marginal weakening against the US dollar in June, making it the worst-performing G10 currency during the month, excluding the dollar itself. Early in June, the Yen was particularly affected by heightened geopolitical risks in the Middle East, which triggered a surge in crude oil prices. This directly impacted the Yen due to Japan's significant reliance on imported energy.
Actions aimed at limiting upside risks to Japanese Government Bond (JGB) yields may have also negatively influenced the Yen. At its June meeting, the BoJ announced a reduction in the pace of its quantitative tightening QT from ¥400 billion per month to ¥200 billion per quarter, a possibility that had been signalled in advance. Furthermore, the Ministry of Finance (MoF) reduced the issuance of super-long JGBs, a measure expected to mitigate upside yield risks. However, short-term interest rates are more influential, as the MoF's updated plans indicate an increase in front-end issuance, and the BoJ is likely to adopt a more hawkish stance, potentially enabling another rate hike by September.
Cryptocurrencies in Q2 and YTD
Bitcoin +30.06% Q2 +14.83% YTD to $107,177.01.
Ethereum +36.61% Q2 -25.35% YTD to $2,488.87.
Crypto markets recovered significantly in Q2 after falling sharply alongside tech stocks in the first quarter despite broader market uncertainties, particularly those related to US tariffs. Investor optimism was fuelled by increasingly positive sounding crypto-friendly policies from the Trump administration and rising expectations of more rate cuts by the Fed this year. In addition, Bitcoin was supported by the increased purchases of Spot Bitcoin ETFs by institutional investors and corporations. Cumulatively, all 11 US Spot Bitcoin ETFs attracted over $4 billion in net inflows in June alone, marking their third straight month of positive flows. It was Bitcoin's and Ether’s strongest Q2 performance since the post-COVID rally in 2020.
Note: As of 5:00 pm EDT 2 July 2025
What to think about in Q3 2025
The US President’s new tariff regime, initiated on 2nd April 2 and continually evolving, marks a significant inflection point in US trade policy. As of 17th June, the average US tariff rate stands at 15.8%, which, according to the Yale Budget Lab, is the highest since 1936. After accounting for consumption shifts, this rate adjusts to 14.7%, a level not seen since 1938. While these figures are below initial expectations, they represent the highest tariff levels the US has experienced in nearly nine decades. Should these tariffs persist, they are expected to have a substantial impact on both the US and global economies, and have already introduced a historic degree of volatility into financial markets.
Tariff increases are typically understood as stagflationary shocks. They simultaneously elevate the probability of an economic slowdown while exerting upward pressure on prices. While the current tariff regime increases the chance of a US recession over the next 12 months, this has yet to materialize in hard economic data. Consequently, due to anticipated higher inflation in the latter half of the year, it is reasonable to expect higher interest rates for longer. As of this writing, the CME FedWatch Tool indicates that markets are pricing in 65.1 bps of rate cuts for the remainder of the year, an increase from 50.1 bps a month ago. Additionally, Fed Chair Jerome Powell will likely adopt a conservative approach to easing monetary policy to guard against fears of runaway inflation.
Economic data have mirrored the volatility observed in markets and trade policy. Soft indicators, such as confidence surveys, have fluctuated in tandem with news of on-again, off-again tariffs. In contrast, hard data, including employment and inflation figures, have demonstrated more resilience. This disparity has contributed to uncertainty and continues to obscure the economic outlook.
On the demand side, the uncertainty surrounding tariffs is currently translating into lower corporate and consumer spending. Fluctuating trade policies have created an unpredictable business environment, prompting companies to delay investment and reevaluate their supply chains. Several surveys have already indicated a contraction in new orders and heightened volatility in US corporate CapEx plans. While consumer confidence did rebound in May after five consecutive months of decline, it remains at levels last seen during the COVID-19 pandemic. Concurrently, tourism, which accounts for 10% of US GDP, has entered a recession, and the housing market is exhibiting signs of softness.
On the supply side, significant headwinds are apparent for sectors and industries that rely on foreign supply chains. Although current tariff levels are lower than initially feared, potential shipping disruptions and higher costs are expected to act as a drag on output and profit margins. Corporate earnings, already undergoing downward revisions, could face further pressure.
Higher US tariffs are also likely to have a substantial impact on the world economy, particularly because the US is a net contributor to global aggregate demand. This situation contrasts with the 1940s, when US tariffs were also high, but the country maintained a trade surplus due to its dominant industrial position, wartime production, and post-war reconstruction efforts abroad. Consequently, analysts now anticipate global GDP growth at a smaller rate than pre-tariff expectations.
Economic and Geopolitical Risk Calendar
In addition to monetary and fiscal policy changes, there are other factors that could affect market performance in Q3 2025. Geopolitical tensions remain high: despite efforts by Trump to get Russia to agree to a permanent ceasefire in Ukraine, Hamas has rejected yet another ceasefire, but the ceasefire between Israel and Iran is still holding. Traders will be focussed on the potential consequences of changes in tariff policies and retaliatory measures as trade frictions are unlikely to be easily settled by the US’ self-imposed 9 July deadline. They will also be considering debt sustainability if the House of Representatives is able to pass the President’s tax bill before 4 July or what type of amendments may be suggested. And finally, the Fed faces a delicate balancing act given the trend higher in continuing claims and inflation risk stemming from the administration’s tariff and migration policies.
Other potential policy and geopolitical risks for investors that could negatively affect corporate earnings, stock market performance, currency valuations, sovereign and corporate bond markets and cryptocurrencies include:
July 2025
6-7 July BRICS+ Summit, Brazil. The summit will welcome its five newest members and nine partner countries for the second time and will likely look into further expanding the bloc. However Chinese President Xi Jinping will miss the BRICS leaders meeting. Premier Li Qiang will represent Xi at the meeting. Xi’s absence could diminish China’s previous efforts to use the BRICS bloc to expand China’s global influence.
10-11 July Ukraine Recovery Summit, Rome Italy. The fourth Ukraine Recovery Conference is a forum for allies of Ukraine to discuss the priorities of rebuilding and reconstructing Ukraine. Officials from international groups such as NATO and the G7, as well as civil society groups, the private sector, and policy think tanks are expected to attend.
17-18 July G20 Finance Ministers and Central Bank Governors’ Meeting, Zimbali, KwaZulu-Natal. Ongoing global trade tensions, concerns around the impact on global economic growth and increasing pockets of geopolitical uncertainty will likely top the agenda.
20 July Parliamentary election, Japan. The 27th general election of the House of Councillors, the upper chamber of parliament, will be held to elect 124 of the 248 members. Japan’s Prime Minister Shigeru Ishiba faces a tough test in this election after his minority government suffered a major defeat in last year's snap election and lost the lower house.
23-24 July ECB Monetary Policy Meeting. With headline inflation in the eurozone at the 2% target, the ECB may choose to pause its rate cutting cycle at this meeting. ECB Chief Economist Philip Lane has suggested that the ECB will remain data-dependent but will not respond to any isolated “blip” in inflation going forward.
29-30 July Federal Reserve Monetary Policy meeting. The Fed is showing signs of increasing divergence in policy opinion, with at least two policymakers suggesting a rate cut in July being appropriate, while Fed chair Jerome Powell insists that the FOMC still has time to wait and see. With tariff uncertainty still remaining and with the Bipartisan Policy Center (BPC) suggesting that the federal government risks defaulting on its debt sometime between 15 August and 3 October without action to address its debt ceiling and agree a budget, a notice that is likely to rile bond markets and negatively impact the dollar, the Fed is likely to continue to be cautious despite increasing pressure from the US president.
30-31 July Bank of Japan Monetary Policy Meeting. BoJ Governor Kazuo Ueda said the central bank will continue to raise interest rates if improvements in the economy keep the country on track to durably achieve its 2% inflation target. However, Board member Naoki Tamura has suggested that the bank may need to raise interest rates "decisively" to address inflation risks. In the 14 months since the BoJ abandoned its negative interest rate policy, it has raised rates by just 60 basis points.
August 2025
7 August BoE Monetary Policy Meeting and Monetary Policy Report. BoE governor Andrew Bailey has stated that the bank is monitoring not just the potential impact from tariffs, but also the ongoing softening in the labour market. BoE governor Andrew Bailey said, “the path of interest rates will continue to be gradually downwards but that policymakers needed to gauge whether persistent inflationary pressures, such as averages wage outpacing inflation and higher energy prices, would continue to soften.” The BoE is closely watching price pressures, which are not falling as quickly as hoped, with the still restrictive monetary policy really not having an effect due to the fall in UK household debt as a share of income. Business balance sheets are also healthier. However, markets are expecting a rate cut at this meeting as signs of economic weakness continue to grow.
September 2025
9-23 September UN General Assembly, New York. The 80th session of the UN General Assembly will open on 9 September. This will bring together global leaders, stakeholders, policymakers and experts. The high-level leader’s week will start on 23 September.
10-11 September European Central Bank Monetary Policy Meeting. The ECB will likely be looking to see what impact the new US tariff regime, combined with improved growth prospects for the eurozone following a region wide commitment to new defence spending, will have on the inflation outlook.
16-17 September Federal Reserve Monetary Policy Meeting. The Fed is widely expected to cut rates by 25 bps during this meeting. The rate cut will depend on the impact that the new tariff regime is having on inflation as well as the impact of a weakening US dollar.
18 September Bank of England Monetary Policy Meeting. The BoE will likely be watching for continuing softness in the labour market and in the economy. However, the Bank may only be considering once a quarter reductions as it wants to see how fiscal and other governmental policies may affect the labour force.
18-19 September Bank of Japan Monetary Policy Meeting. With Japan close to achieving its 2% inflation target due to strong corporate profits and rising wage pressures from labour market shortages, there will be increasing pressure to resume the rate hike cycle at this meeting.
While every effort has been made to verify the accuracy of this information, EXT Ltd. (hereafter known as “EXANTE”) cannot accept any responsibility or liability for reliance by any person on this publication or any of the information, opinions, or conclusions contained in this publication. The findings and views expressed in this publication do not necessarily reflect the views of EXANTE. Any action taken upon the information contained in this publication is strictly at your own risk. EXANTE will not be liable for any loss or damage in connection with this publication.
هذه المقالة متاحة لأغراض ملعوماتية فقط، ولا ينبغي اعتبارها عرضًا أو التماسًا لعرض شراء أو بيع أي استثمارات أو خدمات ذات صلة يمكن الإشارة إليها هنا. ينطوي التداول في الأدوات المالية على مخاطر كبيرة من الخسارة وقد لا يكون مناسبًا لجميع المستثمرين. الأداء السابق ليس مؤشرًا موثوقًا به للأداء المستقبلي.


أنشأ ذلك المتخصصون. للمحترفون.
