

August Equity Review - Where Earnings End and Expectations Begin



Horacio Coutino, Multi-asset Strategist
“Accuracy in economic forecasting is still just an aspiration. With so much changing so fast in geopolitics, global supply chains and technology, it's wise to be modest about what we can and cannot know."
Fed Chair Kevin Warsh, In Our Time, on 28 August, 2026
August converted an exceptional earnings season into a more demanding equity-market test. The S&P 500 advanced 2.62%, led by Energy, Information Technology and Materials. Beneath those gains, however, the market continued to discriminate between earnings delivery, the quality of that delivery and the credibility of the forward path.
The fundamental backdrop strengthened. With almost all S&P 500 companies having reported, blended Q2 earnings growth reached 52.0%, or 33.8% excluding the unusually large investment-related gains at Alphabet and Amazon. The anticipated net profit margin climbed to a record 17.0%. Yet the forward P/E ratio fell to 19.7x from 20.4x at quarter-end, indicating that estimate growth, and not multiple expansion, did most of the valuation work.
Three conclusions warrant investors’ consideration. First, AI demand remains powerful, but the market is separating infrastructure beneficiaries that can convert scarcity and backlog into cash flow from platforms still asking investors to underwrite distant returns. Second, guidance has become the principal clearing mechanism for valuation. An earnings beat is no longer sufficient without acceleration, margin resilience and credible capital discipline. Third, the policy mix is becoming less conventional. An activist Treasury seeking to contain long-duration borrowing costs now sits alongside a Fed determined to restore price stability, creating potential tension between the long end of the curve and the monetary policy path.
This report will analyse:
• S&P 500 earnings growth and estimates for Q2
• Sectoral revisions for Q2 and net profit margins
• Sector-specific monthly performance for US and European equities
Which emerging themes are worth considering after earnings season?
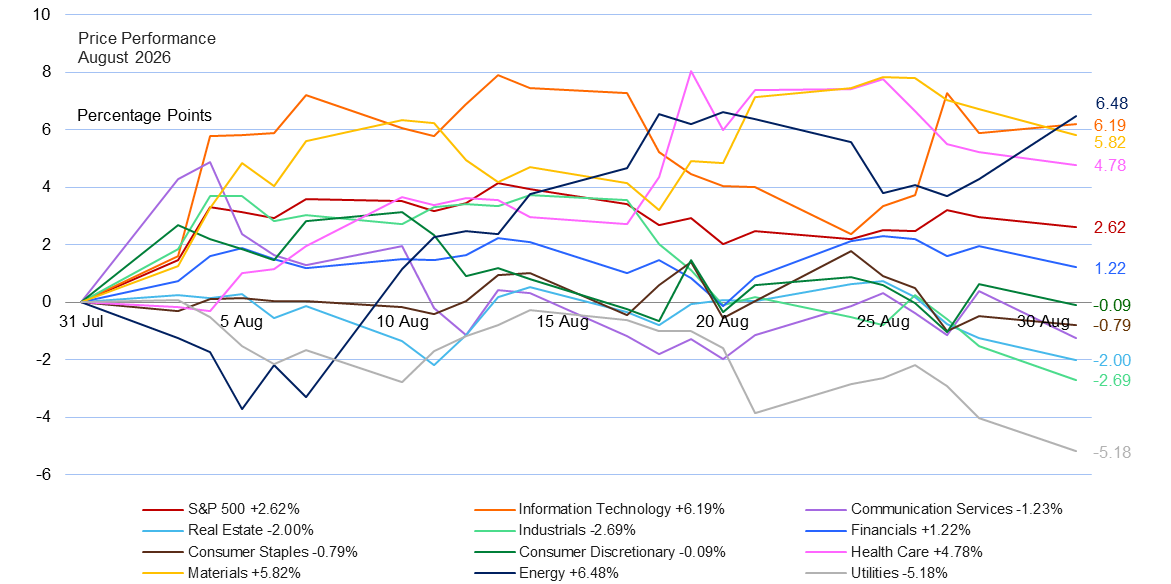
August did not end July’s dispersion; it recast it as the month progressed. The S&P 500 gained 2.62%, but only five of its eleven sectors advanced. Energy rose 6.48%, Information Technology 6.19% and Materials 5.82%, while Utilities fell 5.18%, Industrials 2.69% and Real Estate 2.00%. This was not a uniform risk-on move.
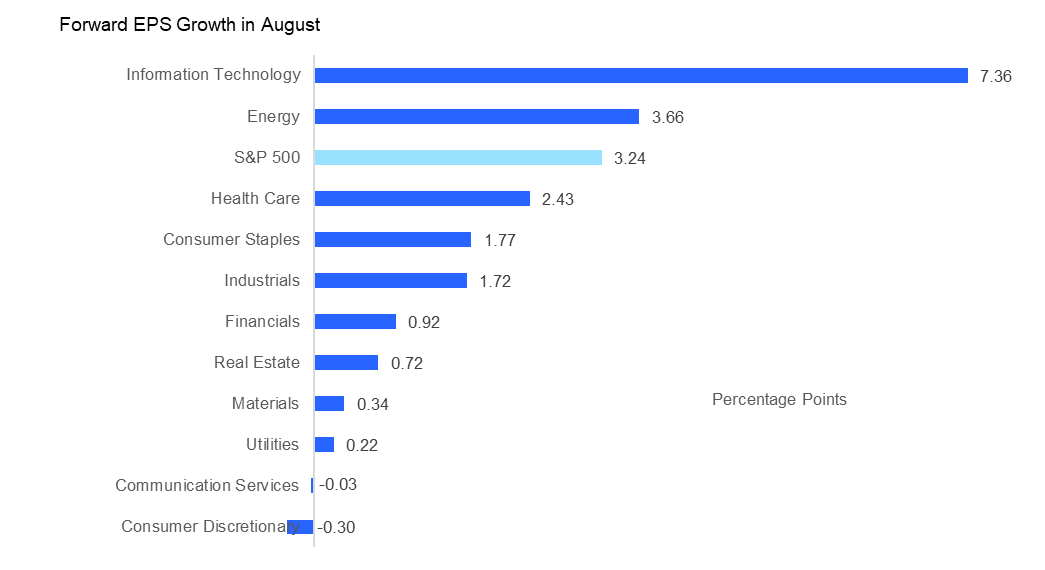
Forward-earnings growth explains part of that selectivity but also shows where price moved ahead of revisions. Next-twelve-month EPS rose 3.24% for the S&P 500 in August, more than the index price, consistent with the forward multiple falling to 19.7x from 20.4x at quarter-end. Information Technology paired a 6.19% price gain with the strongest EPS upgrade, 7.36%, making its recovery fundamentally supported rather than purely multiple-led. Energy’s 6.48% rally exceeded its 3.66% forward-EPS increase. Materials gained 5.82% against only a 0.34% estimate improvement; both incorporated a larger element of cyclical or geopolitical re-rating. The inverse appeared in Industrials, where forward EPS rose 1.72% despite a 2.69% price decline, and in Utilities, where a modest 0.22% earnings upgrade met a 5.18% sell-off.
The earnings season delivered a powerful, but concentrated picture. Blended Q2 S&P 500 earnings growth reached 52.0% but fell to 33.8% after removing Alphabet and Amazon. The headline surprise earnings factor likewise drops from 26.5% to 10.8% without them. Revenue rose 15.5%, 77.3% of companies exceeded sales estimates and the net margin reached 17.0%, or 15.1% excluding the two outliers. Corporate America exited the season with broad operating strength, but investors should distinguish recurring earnings power from balance-sheet marks and one-off tariff refunds.
The clearest reinforced narrative from this earnings season is the durability of the AI CapEx super-cycle, which is broadening and becoming increasingly physical. Microsoft and Amazon demonstrated that cloud acceleration can coexist with operating leverage, while AMD’s data-centre revenue more than doubled and Arista Networks delivered record revenue, wider customer breadth and another guidance increase. Further downstream, Lumentum and Coherent confirmed exceptional optical demand. Cisco Systems surpassed its hyperscaler AI-order target. Applied Materials beat and guided materially above consensus. Memory and storage results showed that capacity, rather than demand, remains the immediate constraint. Nvidia further reinforced this conclusion, with Q2 revenue reaching $96.221 billion, Q3 guidance of $108 billion exceeding consensus expectations and management projecting approximately 70% revenue growth for the following year.
The investment focus has therefore shifted from the scale of AI spending to the pace, operating leverage, margin expansion and balance-sheet distribution of its economic capture. Microsoft’s ability to connect Azure growth to current-period revenue set a different standard from Meta’s sharp capital-intensity increase and FCF compression. Scarcity is supporting pricing in accelerators, memory, optics, networking and power equipment while raising costs for downstream users. Investors should watch backlog conversion, customer concentration, component availability, incremental margins and cash conversion as key drivers going forward.
August also demonstrated that perfection has been capitalised unevenly. Cisco, Coherent and Applied Materials all delivered strong results or outlooks and still sold off, with gross margin detail, incomplete long term guidance or already elevated expectations dominating the reaction. Nvidia’s rare long range forecast succeeded by addressing the market’s central uncertainty over the durability of the spending cycle. At close to 20x forward earnings, guidance is not supplementary disclosure; it is the valuation event.
Beyond AI, the season revealed a more clearly divided economy. Consumer results pointed to affordability pressure rather than outright weakness, as Walmart posted its slowest comparable sales growth in six years, and Home Depot showed greater resilience in repair and professional channels than in large discretionary renovation projects. Value and essential spending remain defensible, while middle income discretionary demand and credit sensitive purchases face a more difficult autumn.
Industrials showed a similar divide. Data-centre construction continued to support power generation, cooling, electrical equipment, networking and selected construction machinery. Agriculture and other traditional cyclical end-markets remained vulnerable. Energy translated geopolitical disruption into exceptional refining profitability and stronger sector estimates, though investors must distinguish a sustained inventory-rebuilding cycle from a temporary crack-spread benefit. In power, Constellation’s contracted nuclear exposure and higher guidance offered a clearer way to monetise data-centre scarcity than merchant generation, where hedging and market design can obscure the earnings signal.
Healthcare showed the sharpest intra-sector divergence. The sector still reported an aggregate earnings decline. Eli Lilly’s incretin franchise delivered exceptional growth and higher guidance, contrasting with legacy pharmaceutical portfolios facing patent cliffs, negotiated pricing and weaker ex-growth businesses. For GLP-1 leaders, catalysts include oral formulations and broader indications, while risks include price dilution, access and premium valuations. Traditional pharma must now rely on pipeline productivity and restructuring to offset the pressure from looming patent cliffs.
How should investors think going forward? The evidence argues against both indiscriminate de-risking and thematic complacency. Earnings revisions have outrun the index, providing genuine fundamental support. However, the dispersion between prices and forward EPS reveals where optimism has already migrated beyond delivery.
Source: FactSet
Q2 earnings in focus
As the Q2 earnings season reaches its final phase, 483 of the 503 components of the S&P 500 index have reported earnings as of 28 September. The S&P 500’s positive performance in August was supported by a strong earnings season. This was despite increasing concerns around the conflict in Iran and its unravelling consequences across the commodity complex and the rise it has caused in short and mid-term inflation expectations. The percentage of companies exceeding earnings expectations is above the 5- and 10-year averages. In aggregate, companies are reporting earnings that are 26.5% above estimates, which is also above the average surprise factor of the prior four quarters, and both the 5- and 10-year average.
Data compiled by LSEG I/B/E/S indicates that, as of 28 September, 96.0% of S&P 500 constituents have reported Q2 results. Of those reporting, 85.7% exceeded EPS estimates, surpassing the prior four quarter average of 80.0%, the 5-year average of 78.0% and the 10-year average of 76.0%.
The rise in the index’s projected Q2 earnings growth since 30 June was driven mainly by unusually large positive EPS surprises from Alphabet and Amazon.
According to FactSet, the blended earnings growth rate for Q2 is 52.0%, higher than the 23.1% forecast at quarter-end. Should this figure stand, it will mark the 12th consecutive quarter of y/o/y earnings growth for the index and its 7th consecutive quarter of double-digit earnings growth. This is the index’s strongest earnings growth rate since Q2 2021, when it reached 91.6%.
Ten of the eleven sectors within the S&P 500 are reporting y/o/y earnings growth, led by Energy, Communication Services, Consumer Discretionary and Information Technology. Nine of these ten sectors are reporting double-digit growth. Conversely, Health Care is the only sector experiencing a y/o/y decline in earnings of 6.5% for the quarter.
Since 30 June, S&P 500 companies have exceeded earnings expectations by an aggregate of 26.5%. This is more than 3x the 5- and the 10-year averages of 7.3% and 7.1%, respectively. It is the S&P 500’s highest surprise percentage since Q2 2020, when it reached 23.2% and the highest on record. However, eexcluding Alphabet and Amazon, the earnings surprise percentage for the S&P 500 for Q2 would decline to 10.8% from 26.5%.
The Communication Services sector demonstrates the most significant positive difference between actual and estimated earnings reflecting an earnings surprise factor of 53.0%. This is followed by Consumer Discretionary at 39.1% and Energy at 19.9%.
With respect to revenue, 77.3% of S&P 500 constituents exceeded projections. This is above the 5-year average of 70.0% and the 10-year average of 67.0%. In aggregate, revenues surpassed estimates by 3.2%, higher than the 5-year average of 1.9% and the prior four quarters average surprise factor of 1.9%. This would be the index’s strongest revenue surprise since Q2 2022, when it also reached 3.2%.
The blended revenue growth rate for Q2 is currently 15.5%, surpassing the 12.2% forecast at quarter-end. Since 30 June, positive revenue surprises in Energy and Financials have been the largest contributors in the overall revenue growth rate. Should the index achieve 15.5% revenue growth for the quarter, it will signify the 23rd consecutive quarter of revenue growth, and the highest revenue growth rate recorded by the index since Q4 2021’s 16.1%.
All eleven sectors are reporting y/o/y revenue growth, led by Energy and Information Technology.
The forward 12-month P/E ratio of the S&P 500 stands at 19.7x, which is below the 5-year average of 19.9x, but above the 10-year average of 18.9x. The P/E ratio is lower than the 20.4x recorded at the end of the Q2.
S&P 500 Earnings Growth in Q2: 52.0%
According to FactSet, the projected y/o/y earnings growth rate for Q2 2026 is 52.0%. This figure is above the 5-year average of 15.2% and above the 10-year average of 11.2%. Sector-specific analysis reveals that ten of the eleven sectors within the S&P 500 are reporting y/o/y earnings growth, led by Energy, Communication Services, Consumer Discretionary, Information Technology and Materials. Eight of these ten sectors are reporting double-digit growth. Conversely, Health Care is the only sector expected to report a y/o/y decline in earnings.
If the 52.0% growth rate is confirmed, it would represent the index's strongest quarterly earnings growth since Q2 2021, when earnings rose 91.6%. Excluding Alphabet and Amazon, the S&P 500's blended Q2 2026 earnings growth rate would decline from 52.0% to 33.8%. However, this would still mark the 2nd consecutive quarter of y/o/y earnings growth above twenty five percent and the 7th consecutive quarter of double-digit growth for the index.
Energy is expected to report the highest y/o/y earnings growth rate of all eleven sectors at 146.3%. At the industry level, three of the five industries in the sector are projected to report y/o/y earnings growth above one hundred percent. The Oil & Gas Refining & Marketing industry is expected to be the largest contributor to earnings growth for the sector.
The Communication Services is forecast to deliver the second-highest y/o/y earnings growth, with an increase of 116.9%. At the industry level, three of the five constituent industries are anticipated to achieve earnings growth, and two of these industries are expected to achieve growth above one hundred percent. Excluding Alphabet, the Communication Services sector would be reporting a y/o/y earnings growth of 5.6%.
Consumer Discretionary reports the third-highest y/o/y earnings growth rate among the eleven sectors, with a 92.4% increase. At the industry level within the sector, six out of nine industries are demonstrating y/o/y earnings growth. Three industries are exhibiting double-digit growth or higher. Conversely, three industries have reported a y/o/y decline in earnings.
In contrast, the Health Care sector is projected to experience a y/o/y decline in earnings, with a decrease of 6.5%. At the industry level, two out of six industries are forecast to deliver negative earnings growth. At the company level, Gilead Sciences and Merck delivered the sector’s most pronounced negative earnings surprises. Excluding both companies, the Health Care sector would be reporting earnings growth of 18.1%.
Since 30 June, S&P 500 companies have exceeded earnings expectations by an aggregate of 26.5%, the highest on record, since FactSet began tracking this metric in 2008. This is more than 3x the 5- and the 10-year averages of 7.3% and 7.1%, respectively, and more than 2x the average surprise factor observed in the preceding four quarters of 9.2%.
Communication Services recorded the largest positive difference between reported and estimated earnings, with an earnings surprise factor of 102.3%. At the company level, EchoStar delivered the most pronounced upside surprise, reporting EPS of $24.12 versus an anticipated loss of 1 cent per share. It was followed by Warner Bros Discovery, which reported EPS of 6 cents compared with an expected loss of 14 cents per share. Alphabet’s EPS of $9.11, exceeded the anticipated $2.88. As a result, the sector's blended earnings growth rate has risen sharply, from 7.2% at the end of Q2 to 116.9%. Across the S&P 500 sectors, Communication Services presents the most substantial improvement in sector earnings growth since 30 June.
Consumer Discretionary reported the second-largest positive difference between actual and estimated earnings, reflecting a surprise factor of 82.3%. Nike accounted for the sector's largest EPS surprise, reporting EPS of $0.72 against expectations of $0.121, and Amazon’s EPS of $5.75 surpassed the $1.82 estimate. Nike’s actual EPS included a $0.52 benefit from the expected recovery of IEEPA tariffs, while Amazon’s actual EPS included a $53.4 billion gain in other income, primarily from its investment in Anthropic. Consumer Discretionary blended earnings growth rate has improved dramatically from 5.0% projected at quarter-end to 92.4% now.
Despite reporting a y/o/y decline in blended earnings growth, Health Care follows with an earnings surprise factor of 18.1%. Centene, Baxter International and Merck delivered the largest positive EPS surprises supporting Health Care’s earnings growth. Centene reported EPS of $2.51 versus the $1.09 estimate, Baxter International posted EPS of $0.56 versus $0.37 expected, and Merck’s loss of $0.13 per share was narrower than the projected $0.27 loss. Consequently, the anticipated y/o/y decline in earnings for the sector has improved from an anticipated 9.0% y/o/y decline on 30 June to a 6.5% y/o/y decline today.
Financials reported the fourth-largest positive (aggregate) difference between actual earnings and estimated earnings at 14.7%. Within this sector, the companies that surpassed expectations with the largest earnings surprise factors are Travelers Companies, Allstate and Goldman Sachs. Travelers reported EPS of $10.04 versus an expected $5.41, Allstate reported EPS of $8.99 compared with expectations of $6.06 and Goldman Sachs reported EPS of $20.98, above the $14.51 estimate. Consequently, the sector's blended earnings growth rate has increased from 5.2% at 30 June to 22.0%.
With respect to revenue, 77.3% of S&P 500 constituents exceeded projections. This is above the 5-year average of 70.0% and the 10-year average of 67.0%. In aggregate, revenues surpassed estimates by 3.2%, higher than the 5-year average of 1.9%, the prior four quarters average surprise factor of 1.9% and the 10-year average of 1.6%.
The blended revenue growth rate for Q2 is currently 15.5%, surpassing the 12.2% forecast at quarter-end. Since 30 June, positive revenue surprises in Energy and Financials have been the largest contributors in the overall revenue growth rate. Should the index achieve 15.5% revenue growth for the quarter, it will signify the 23rd consecutive quarter of revenue growth, and the highest revenue growth rate recorded by the index since Q4 2021’s 16.1%.
All eleven sectors are reporting y/o/y revenue growth. Since 30 June, ten sectors have recorded an increase in their revenue growth rate or a decrease in their revenue decline since the end of the quarter. Utilities is the only sector reporting a y/o/y decline in its revenue growth rate since the end of the quarter due to downward revisions to revenue estimates and negative revenue surprises, from 8.3% to 5.4%.
S&P 500 Net Profit margin in Q2: 17.0%
The projected net profit margin for the S&P 500 in Q2 stands at 17.0%. This figure is above the net profit margin recorded in the previous quarter of 14.8% and surpasses both the margin from the same quarter last year, which was 12.9%, and the five-year average of 12.4%. Should the net profit margin for the quarter reach 17.0%, it would represent the highest figure recorded by the index since FactSet commenced tracking this metric in 2009. The current record, dating back to 2009, stands at 14.8%, which was achieved in the preceding quarter. If Amazon and Alphabet are excluded, the S&P 500’s blended net profit margin would decline from 17.0% to 15.1%.
At the sector level, nine sectors are forecast to achieve a y/o/y increase in net profit margins in Q2 2026 compared to the same period in 2025. Leading this growth is Communication Services, with a 13.4 percentage point increase, from 15.2% to 28.6%, followed by Consumer Discretionary, with a 7.1 percentage point increase to 16.5% from 9.4%, and Information Technology with 7.0 percentage point increase, from 25.2% to 32.2%.
There are two sectors that have reported y/o/y declines in their net profit margins: Health Care, with a decrease of 1.0 percentage points, from 8.1% to 7.1%, and Real Estate with a 0.8 percentage point decrease to 34.1% from 34.9%.
Nine sectors are forecast to report net profit margins in Q2 that exceed their respective five-year averages. Communication Services has demonstrated the most significant improvement, attaining 28.6% compared to a five-year average of 13.0%. In contrast, two sectors are predicted to report net profit margins below their five-year averages, led by Health Care and Real Estate, expected to post margins 1.8 and 1.5 percentage points lower than their five-year averages of 8.9% and 35.6%, respectively.
Looking forward to the rest of 2026
Looking ahead, analysts forecast y/o/y earnings growth rates of 28.2% and 25.8%, for Q3 and Q4, respectively. For the entirety of calendar year 2026, analysts are anticipating a y/o/y earnings growth of 31.2%.
As of 28 August, the bottom-up target price over the next 12 months for the S&P 500 is set at 9,204.34, representing a 19.8% increase over the closing price of 7,686.14 of 31 August.
Based on the difference between bottom-up target prices and closing prices, the sectors with the most significant anticipated price appreciation are Communication Services, at 25.0%, Information Technology at 24.3%, and Consumer Discretionary at 21.1%. In comparison, the smallest expected price increases are forecast for Energy, expected to increase 9.5%, Financials, with an anticipated rise of 10.1%, and Health Care, expected to have a 10.2% increase.
Regional breakdown
US Equities
Note: FactSet. As of 5 pm EDT 31 August 2026
Source: FactSet
Five of the eleven S&P 500 sectors were up in August. Energy outperformed at 6.48%, followed by Information Technology at 6.19% and Materials at 5.82%. The biggest underperformer was Utilities, declining 5.18%, followed by Industrials decreasing 2.69% and Real Estate at 2.00%.
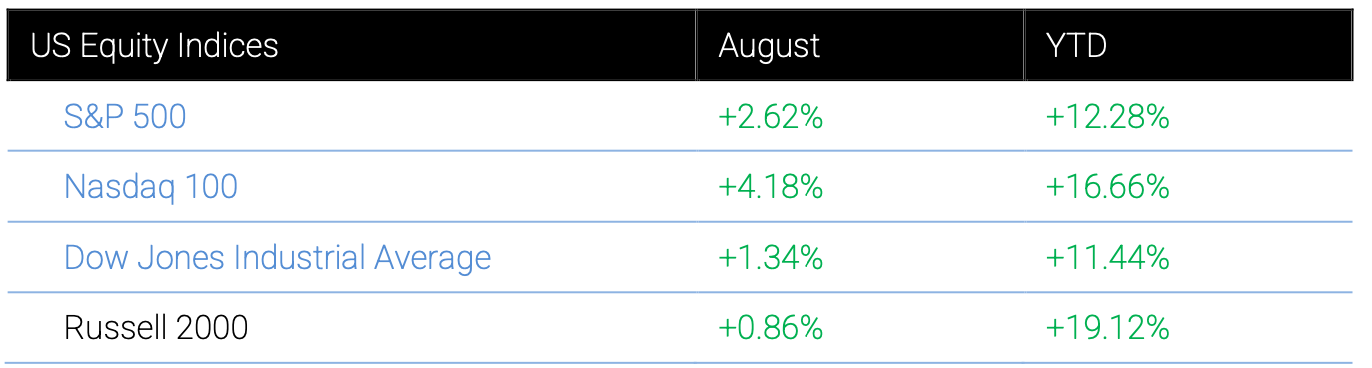
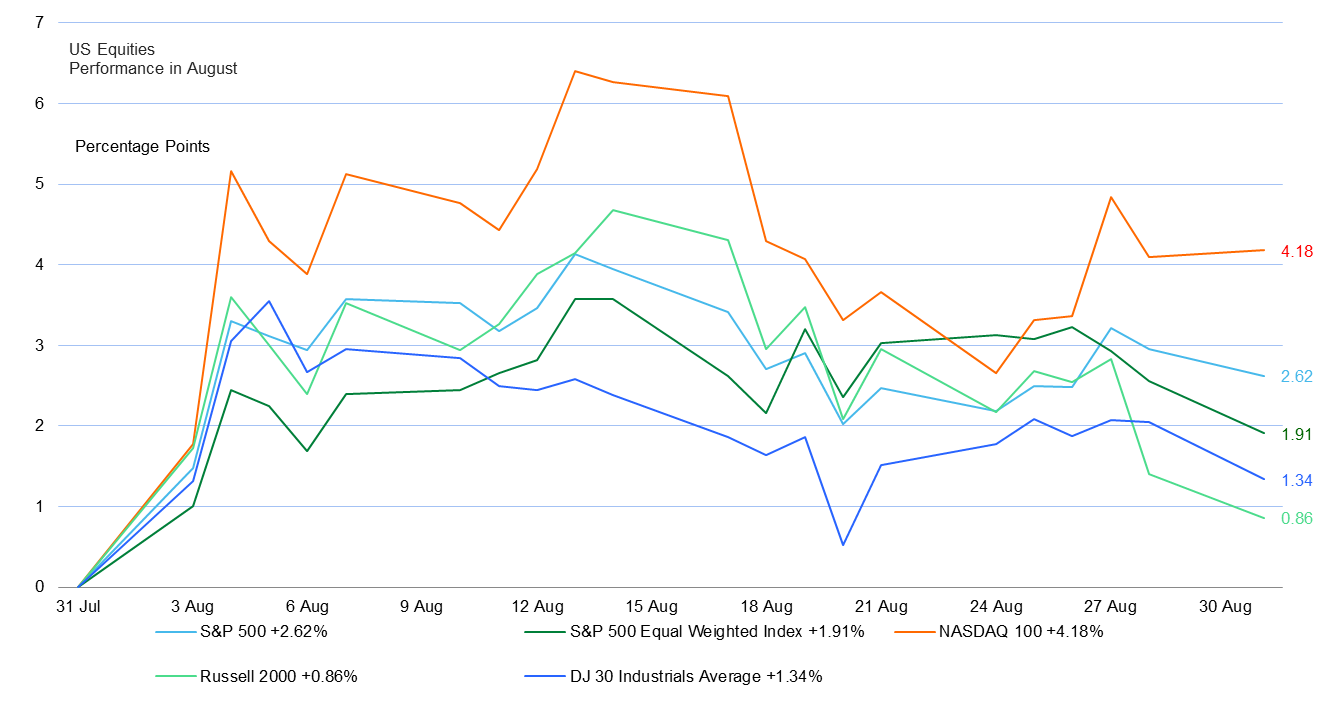
In August, the equal-weighted S&P 500 underperformed the benchmark by 0.71 percentage points, recording an increase of 1.91%, compared to the S&P 500's gain of 2.62%. However, despite August’s underperformance of the equal-weighted version, it has so far outperformed the index by 2.0 percentage points year-to-date.
A review of the past five years (60 months) reveals that the August performance across all four major US stock indices was slightly better than normal, with three of the four major indices recording monthly performance above their median. Two out of the four indices delivered results above their respective 60th percentile. The Nasdaq 100, with a monthly performance of 4.18%, was the strongest showing among the major US equity benchmarks, positioning it at its 66.1st percentile of the past 60-month performance distribution.
The S&P 500 ranked at the 61.0th percentile for August, with an increase of 2.62%, with 23 of the previous 60 months delivering stronger results. The Russell 2000 advanced 0.84%, placing it at the 52.5th percentile. The Dow Jones Industrial Average was the weakest of the four major US indices on a monthly percentile basis. It rose 1.34% but fell below its median monthly performance and ranking at the 49.1st percentile, meaning 31 of the past 60 months recorded a stronger performance.
European Equities
Note: FactSet. As of 5 pm EDT 31 August 2026
Source: FactSet
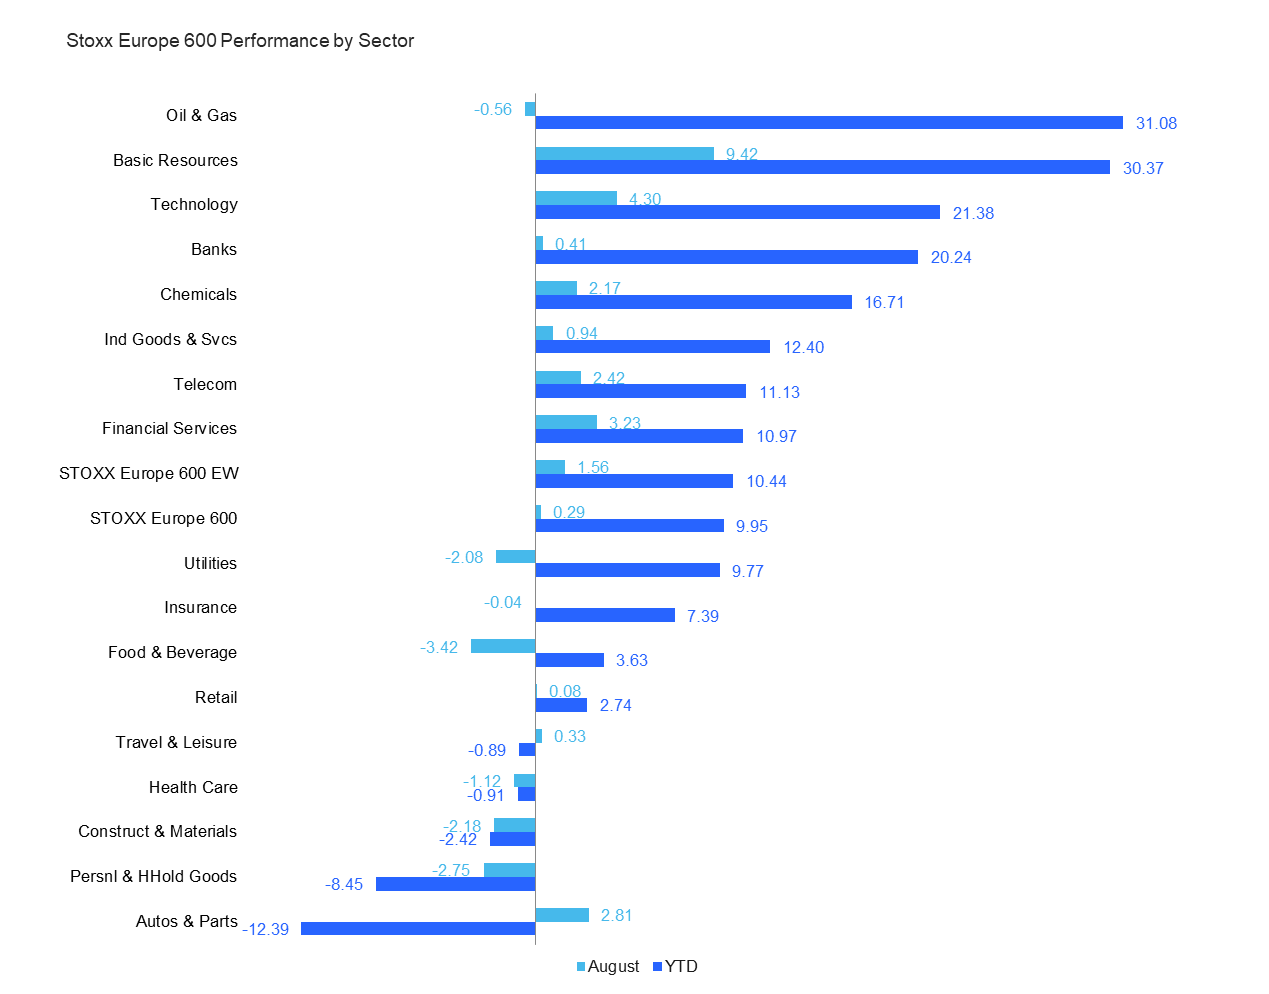
During the month of August, the Stoxx Europe 600 witnessed positive performance in ten out of its seventeen sectors. Basic Resources outperformed within the index, advancing 9.42%, followed by Technology and Financial Services at 4.30% and 3.23%, respectively. In contrast, Food & Beverages recorded a decline of 3.42%, followed by Personal & Household Goods and Construction & Materials, down 2.75% and 2.18%, respectively.
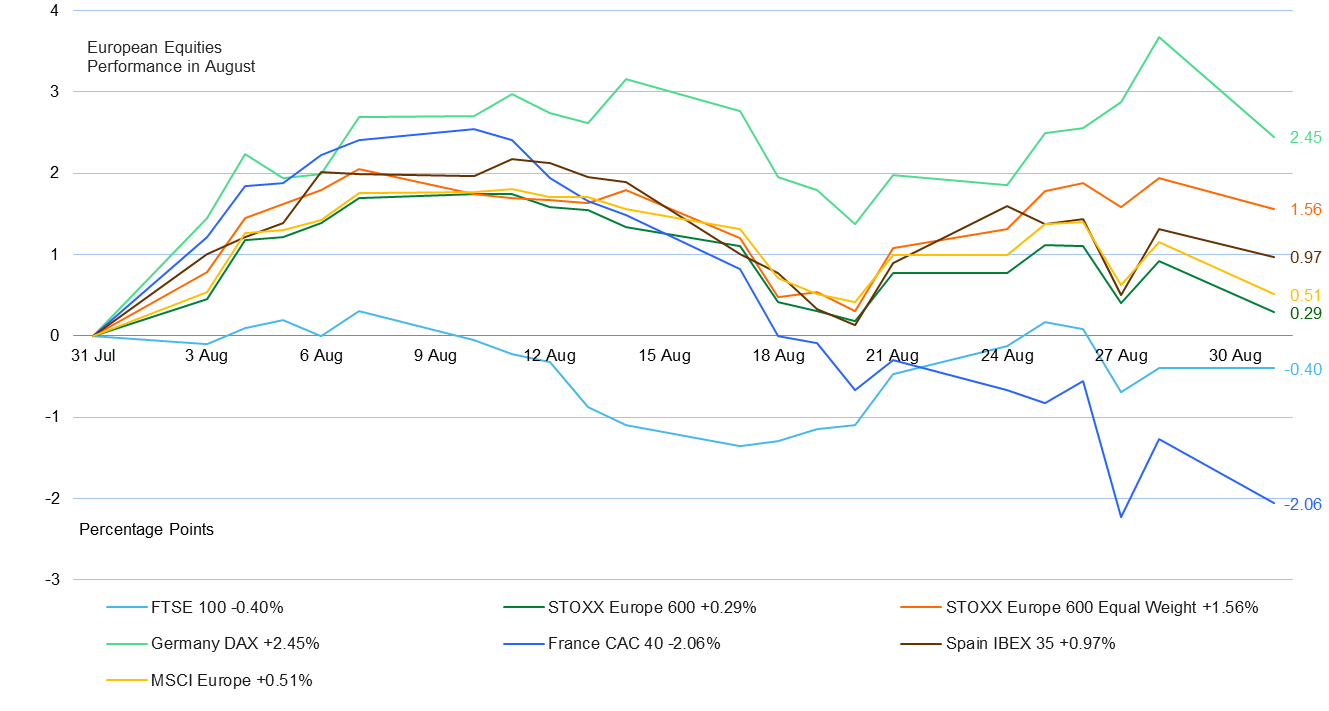
A review of the Stoxx Europe 600 Equal Weight (EW) index provides further insight. Unlike the standard index, which is weighted by market capitalisation, the EW index assigns equal weight to each constituent. In August, it recorded a gain of 1.75%, which was 1.27 percentage points more than the standard Stoxx Europe 600's increase of 0.29%. The Stoxx 600 posted a fifth consecutive monthly gain and reached a new record high earlier in the month, although performance was uneven across the region. Strong Q2 earnings helped European markets withstand global spillovers, while the broader macro backdrop remained resilient.
Source: FactSet
An examination of equity index performance over the past five years (60 months) indicates that the results for July rank among the most divergent monthly outcomes observed in this period for European markets. Performance across individual countries showed high divergence, with two of the six major indices recording monthly returns lower than their 40th percentile of their respective 60-month distributions, and only one recording a monthly return higher than its median monthly performance.
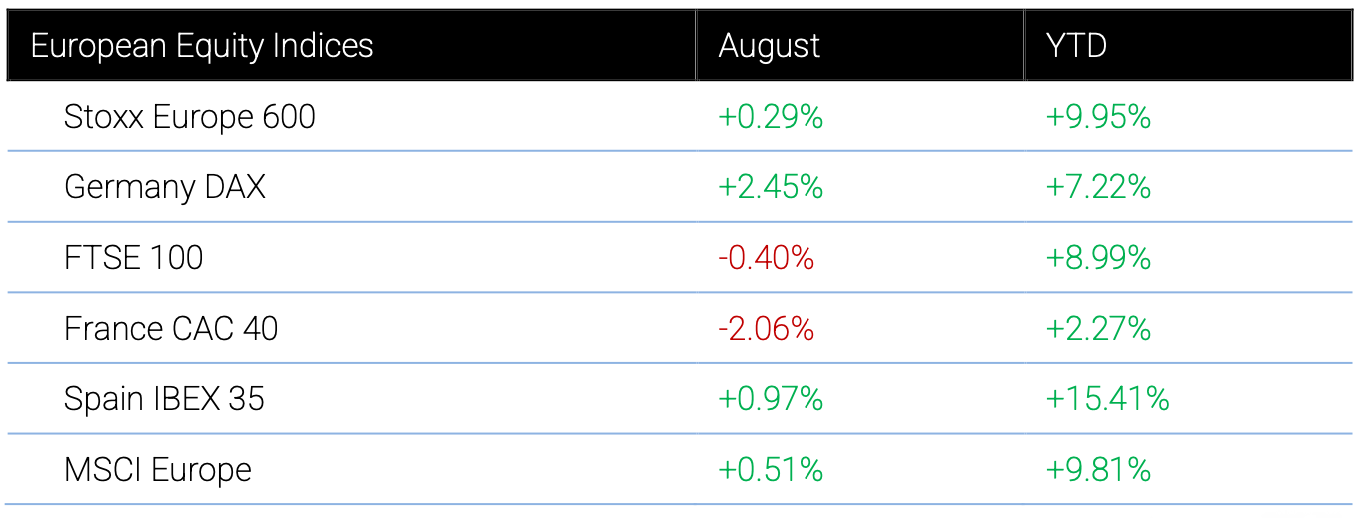
Specifically, Germany’s DAX advanced 2.45%, placing it at the 64.4th percentile of its five-year performance distribution. Both the MSCI Europe and the Stoxx Europe 600 each posted August gains that positioned them at their respective 44.0th and 40.6th percentiles, indicating that more than 30 months out of the past 60 produced stronger results.
In August, Spain’s IBEX 35 advanced 0.97%, placing it at the 47.4th percentile, indicating that thirty-two months out of the past sixty produced stronger results. FTSE 100’s delivered a negative performance of 0.40% that positioned it at its 30.5th percentile. France’s CAC 40 decline of 2.05% ranked at the 28.8th percentile within its 5-year monthly performance distribution.
As of 27 August, according to LSEG I/B/E/S data for the Stoxx 600, Q2 2026 earnings are expected to increase 23.9% from Q2 2025. Excluding the Energy sector, earnings are projected to increase 12.9%. Q2 2026 revenue is expected to increase 11.6% from Q2 2025. Excluding the Energy sector, revenues are anticipated to increase 6.9%. Of the 294 companies in the Stoxx 600 that reported earnings for Q2 by 27 August, 59.9% reported results exceeding analyst estimates. In a typical quarter 54% beat analyst EPS estimates. Of the 367 companies in the Stoxx 600 that have reported revenue for Q2, 68.1% reported revenue exceeding analyst estimates. In a typical quarter 58% beat analyst revenue estimates.
The Stoxx 600 expects to see share-weighted earnings of €166.5 billion in Q2 compared to share-weighted earnings of €134.3 billion (based on the year-ago earnings of the current constituents) in Q2 2025. Companies are collectively reporting earnings that are 6.9% above estimates. This figure is higher than the long-term average surprise factor of 5.9% observed since 2012.
Nine of the ten sectors in the index expect improved earnings compared to Q2 2025. At 138.6%, the Energy sector has the highest earnings growth rate for the quarter, while Real Estate has the highest anticipated contraction of 5.4% compared to Q2 2025.
The forward four-quarter price-to-earnings ratio (P/E) for the Stoxx 600 sits at 14.8x. This is above the 10-year average of 14.2x.
The Stoxx 600 is up 1.60% since this earnings season began on 10 July.
Analysts anticipate positive Q2 earnings growth in fourteen of the sixteen countries comprising the Stoxx 600 index. Poland, with an estimated growth rate of 142.1%, and Austria, at 81.4%, are projected to have the highest earnings growth, whereas Ireland and Denmark are expected to experience the most significant declines, estimated at 33.2% and 7.5%, respectively.
هذه المقالة متاحة لأغراض معلوماتية فقط، ولا ينبغي اعتبارها عرضًا أو التماسًا لعرض شراء أو بيع أي استثمارات أو خدمات ذات صلة يمكن الإشارة إليها هنا. ينطوي التداول في الأدوات المالية على مخاطر كبيرة من الخسارة وقد لا يكون مناسبًا لجميع المستثمرين. الأداء السابق ليس مؤشرًا موثوقًا به للأداء المستقبلي.








أنشأها المتخصصون. للمحترفين.
