

Is policy flexibility in Europe running out?


 S&P 500 +0.95% last week to 7,473.47 US 10-year yield -3.3 basis points last week to 4.563% Spot gold -0.65% last week to $4,508.73 an ounce DXY +0.05% last week to 99.32
 Key data to move markets today
US: Markets closed for Memorial Day holiday
Global Macro Updates
ECB constraints tighten amid weak growth. This week was shaped by the interaction of three major themes: an AI-driven reacceleration in global growth, tentative signs of de-escalation in the US-Iran conflict and an increasingly stagflationary macro backdrop in Europe that is tightening constraints on both ECB policy and fiscal flexibility. Geopolitical sentiment remained fluid, with markets responding to shifting signals around the conflict. Comments from the US President indicating that planned strikes had been paused to allow space for negotiations, together with Iranian statements suggesting that gaps between the two sides were narrowing, helped support broader risk sentiment. Elsewhere, the US President’s reported pledge of 5,000 troops to Poland reinforced expectations of selective NATO reinforcement along the eastern flank. In trade, reports suggested that the EU is moving to finalise its trade arrangement with Washington ahead of the 4 July deadline.
Within the euro area, ECB communication and broader reporting pointed to a gradual hawkish repricing, as officials including ECB President Cristine Lagarde, Bank of Finland Governor Olli Rehn and National Bank of Belgium Governor Pierre Wunsch signalled less tolerance for premature easing. Lagarde’s warning that inflation could reaccelerate even if the Strait of Hormuz were reopened underscored the importance of energy pass-through risks. At the same time, the European Commission revised its 2026 euro area growth forecast down to 0.9% while raising its inflation projection to 3.1%. Recent activity data reinforced the broader slowdown narrative: the euro area composite PMI fell to a 31-month low, driven largely by a sharp contraction in French services, although this was partly offset by resilient German Q1 GDP growth of 0.3% and signs of stabilisation in sentiment indicators.
In the UK, the week was marked by pronounced volatility in the gilt market against a backdrop of political uncertainty and softer domestic macro conditions. Although April inflation moderated, this was offset by weaker activity indicators, including a decline in retail sales, a renewed contraction in business activity and continued softening in the labour market. Commentary from BoE MPC External Member Alan Taylor suggested that further rate increases remain a tail risk rather than the central scenario, a view broadly reinforced by BoE Deputy Governor Sarah Breeden’s warning against overreacting to short-term inflation movements. On the fiscal side, Chancellor Reeves announced additional cost-of-living measures, while higher-than-expected borrowing added to concerns over limited fiscal space. Politically, discussion surrounding Greater Manchester Mayor Burnham pointed to a strengthened position ahead of a possible by-election route that could later influence wider Labour leadership dynamics.
US Stock Indices
Dow Jones Industrial Average +0.58%
Nasdaq 100 +0.42%
S&P 500 +0.37%, with 9 of the 11 sectors of the S&P 500 up
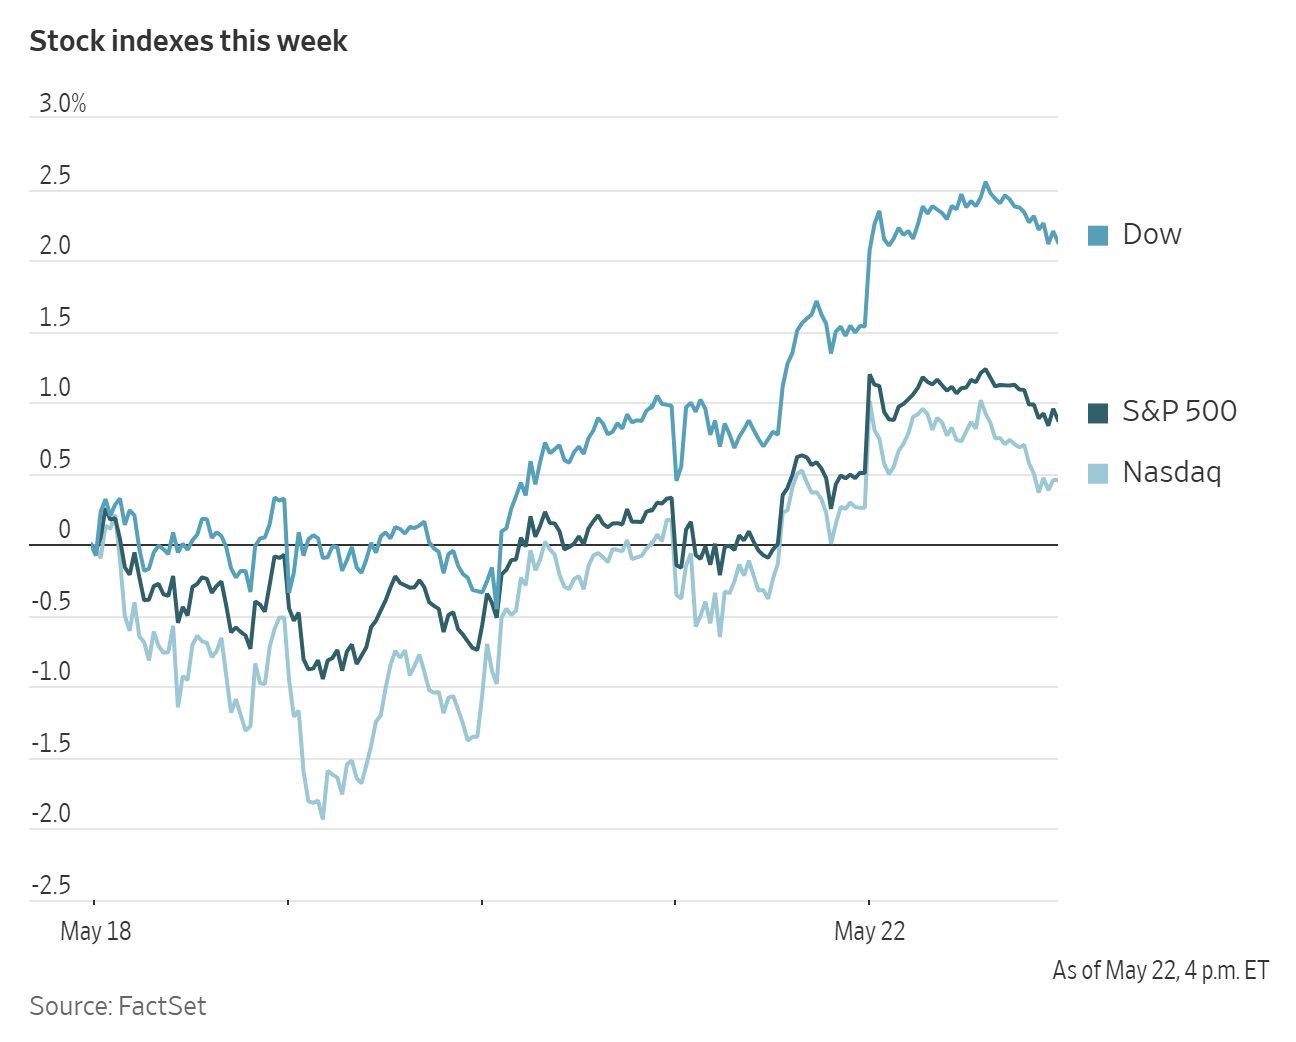
US equities ended the week on a firm footing, with the Dow Jones Industrial Average closing at another record high and the S&P 500 extending its winning streak to eight consecutive weeks.
The Nasdaq Composite rose +0.19%, or 50.87 points, to 26,343.97, while the S&P 500 gained +0.37%, or 27.75 points, to 7,473.47. The Dow Jones Industrial Average advanced +0.58%, or 294.00 points, to 50,579.70.
For the week, the S&P 500 rose +0.95%, the Nasdaq Composite gained +0.97% and the Dow Jones Industrial Average advanced +1.80%.
According to LSEG I/B/E/S data, y/o/y earnings growth for the S&P 500 in Q1 2026 is projected to be +29.0%. This jumps to +30.4% when excluding the Energy sector.
Of the 471 companies in the S&P 500 that have reported earnings to date for Q1, 83.7% have reported earnings above analyst estimates, with 79.2% of companies reporting revenues exceeding analyst expectations. The y/o/y revenue growth is projected to be 11.2% in Q1, increasing to 11.8% when excluding the Energy sector.
Information Technology at 98.4%, is the sector with most companies reporting above estimates. Additionally, Energy with a surprise factor of 19.0%, is the sector that has beaten earnings expectations by the highest surprise factor. Within Communication Services, 35.0% of companies have reported below estimates. It is also the sector with the smallest surprise factor, exceeding estimates by 2.7%. The S&P 500 surprise factor is 8.0%. The forward four-quarter price-to-earnings ratio (P/E) for the S&P 500 sits at 21.4x.
10 S&P 500 companies are scheduled to release their Q1 earnings reports this week.
In corporate news, Anthropic is expected to close its latest funding round as early as next week. According to people familiar with the matter, the round could exceed $30 billion and value the company at more than $900 billion, positioning it ahead of OpenAI as the world’s most valuable AI startup.
Workday, which develops workplace management software, reported better-than-expected first-quarter results, helping to ease concerns that its business could face disruption from AI.
Uber Technologies is exploring options for a full takeover of Delivery Hero, according to people familiar with the matter as reported by Bloomberg news, in a move that could strengthen its competitive position against DoorDash outside the US.
S&P 500 Best performing sector
Health Care +1.19%, with Merck +5.64%, Cencora +3.57% and Edwards Lifesciences +3.10%
S&P 500 Worst performing sector
Communication Services -0.68%, with Take-Two Interactive Software -4.42%, Charter Communications -2.52% and News -1.41%
Mega Caps
Alphabet -1.07%, Amazon -0.80%, Apple +1.26%, Meta Platforms +0.47%, Microsoft -0.12%, Nvidia -1.90% and Tesla +1.95%
Information Technology
Best performer: Dell +16.77%
Worst performer: Nvidia -1.90%
Materials and Mining
Best performer: Steel Dynamics +3.53%
Worst performer: Celanese -0.96%
European Stock Indices
CAC 40 +0.37%
DAX +1.15%
FTSE 100 +0.22%
Commodities
Gold spot -0.78% to $4,508.73 an ounce
Silver spot -1.57% to $75.49 an ounce
West Texas Intermediate -1.01% to $97.01 a barrel
Brent crude -0.86% to $104.02 a barrel
Gold fell on Friday and recorded its second straight weekly loss.
Spot gold was down -0.78% at $4,508.73 per ounce, after falling one percent earlier in the session. It was down -0.65% for the week.
Spot silver fell -1.57% to $75.49 per ounce. It recorded a -0.61% weekly decline.
Oil prices declined on Friday, extending a week marked by significant volatility.
Brent crude futures settled at $104.02 per barrel, down 90 cents, or -0.86%, while US WTI crude closed at $97.01 per barrel, down 99 cents, or -1.01%. Both benchmarks had risen by more than three percent earlier in the session before reversing course.
For the week, Brent declined -4.75%, while WTI fell -8.19%.
The ceasefire has now remained in effect for a sixth week, even as the war approaches the three-month mark. Crude and refined product markets continue to respond primarily to developments surrounding a possible peace agreement between Washington and Tehran. Recent updates suggest that the two sides have made progress on several narrower issues, but remain divided on major points, including control of enriched uranium and authority over the Strait.
In response to the continued blockage of the Strait, several EU nations moved toward imposing sanctions on Iran, while NATO Secretary General Mark Rutte stated that countries must coordinate a plan to keep the Strait of Hormuz open. Reports earlier in the week indicated that NATO was considering deploying forces to escort vessels through the Strait if the waterway is not reopened by July. At the same time, analysts and research groups continued to highlight an accelerating drawdown in global stockpiles.
The US Department of Energy’s Weekly Petroleum Status Report showed a fourteenth consecutive weekly draw in gasoline inventories, a second straight modest build in distillate stocks and a fourth consecutive weekly decline in crude inventories. Combined draws from commercial crude stocks and the Strategic Petroleum Reserve totalled 17.76 million barrels, a record level. Jet fuel production also remained above 2.0 million barrels per day (bpd) for a fifth consecutive week, while Cushing inventories fell below 26 million barrels. OPEC-7 is expected to raise combined production quotas by a further 188,000 bpd from July when it meets on 7 June.
Data released this week pointed to continued weakness in several key indicators. China’s refinery throughput in April fell to a 44-month low. For the same month, OilChem reported m/o/m increases in Chinese gasoline and distillate inventories, while Vortexa estimated that onshore oil stocks in China rose by 17 million barrels. China’s fuel oil imports in April also dropped to their lowest level in nearly four years, as weaker demand for feedstock followed refinery slowdowns linked to the US-Iran war. Product stockpiles at the port of Fujairah ended a 10-week draw streak, rising by 96,000 bpd to 6.593 million barrels. JODI data showed Saudi Arabia’s crude exports averaging 4.974 million bpd, down from 7.276 million barrels per day in February. Kpler data also indicated that month-to-date crude imports into China were down by 1.222 million bpd to 6.766 million bpd.
Broader stockpile trends also remain a central focus. Kpler data showed that oil-on-water volumes continued to decline, while HFI estimated that observable oil inventories have fallen by more than 120 million barrels over the past two weeks. Goldman Sachs estimated that month-to-date visible global crude and product inventories have been drawing at a record pace of 8.7 million bpd, nearly double the average rate seen since the war began. Since the start of the conflict, US product stockpiles have declined by nearly 50 million barrels, whereas the 10-year average would normally indicate inventory builds over the same period. The Oxford Institute estimates that global stockpile draws will average 10.2 million bpd in May and 11.2 million bpd in June. IEA Executive Director Fatih Birol said on Friday that oil markets could enter a ‘red zone’ in July and August as stockpiles tighten and summer demand strengthens.
Note: As of 4 pm EDT 22 May 2026
Currencies
EUR -0.14% to $1.1602
GBP -0.00% to $1.3427
Bitcoin -2.19% to $75,908.80
Ethereum -2.69% to $2,076.36
The US dollar remained near six-week highs on Friday.
Kevin Warsh was sworn in as Chair of the Fed on Friday.
The dollar index rose +0.12% to 99.32, while the euro fell -0.14% to $1.1602. For the week, the dollar index advanced +0.05%, while the euro declined -0.18%.
Sterling ended Friday’s session little changed at $1.3427, despite data showing that UK retail sales recorded their sharpest monthly decline in nearly a year in April, as consumers continued to feel the inflationary effects of the Iran war. For the week, the pound gained +0.80%.
The yen fell -0.15% against the dollar on Friday to ¥159.19 per dollar.
The yen remained under pressure even after what was widely seen as intervention by Tokyo only weeks earlier. Since then, it has surrendered nearly 75% of those gains, leaving traders alert to the possibility of further action by Japanese authorities. On a weekly basis, the yen declined -0.27%.
The BoJ is expected to raise borrowing costs only gradually, while other central banks, including the ECB, are likely to move more quickly, leaving the yen at a disadvantage with yield-seeking investors.
Data released on Friday showed that Japan’s core inflation slowed to a four-year low in April, further complicating the outlook for BoJ policy.
Fixed Income
US 10-year Bond -1.0 basis points to 4.563%
German 10-year Bund -5.7 basis points to 3.043%
UK 10-year gilt -5.5 basis points to 4.911%
The US yield curve bear flattened, as short-dated US Treasury yields climbed while long-term yields declined on Friday.
The 2-year note yield, closely aligned with expectations for the Fed funds rate, rose +4.0 bps to 4.132%. The yield on the US 10-year note decreased -1.0 bps to 4.563%.
On the long end of the maturity spectrum, the 30-year bond yield fell by -2.5 bps to 5.068%.
Over the week, the 2-year yield advanced +5.7 bps, the 10-year yield declined -3.3 bps and the 30-year yield declined by -5.2 bps.
The US Treasury yield curve, measured by the spread between the 2-year and 10-year notes, flattened over the week as the spread narrowed 9.0 bps from last week’s 52.1 bps to 43.1 bps.
According to CME Group's FedWatch Tool, Fed funds futures traders are pricing 23.1 bps of rate hikes in 2026, higher than the 15.7 bps priced in a week ago. Fed funds futures traders are now pricing in a 2.7% probability of a 25 bps rate hike at June’s FOMC meeting, compared to a 1.3% probability of a rate cut last week.
Euro area bond yields declined on Friday, easing government borrowing costs from the multi-year highs reached earlier in the week.
The move kept the spread between US and German 10-year bond yields near its widest level since August 2025, reflecting stronger market expectations for further Federal Reserve rate increases.
Germany’s 10-year Bund yield fell -5.7 bps to 3.043%, its lowest level since 11 May. Over the week, the Bund yield declined by -12.7 bps.
Germany’s 2-year Schatz yield declined -4.6 bps on Friday to 2.647%, bringing its weekly fall to -10.3 bps. The 30-year German yield also moved lower, falling -4.9 bps to 3.572% and leaving it down -10.4 bps for the week.
Earlier in the week, Germany’s 10-year yield reached a 15-year high of 3.200% on Tuesday as investors braced for additional interest rate increases after energy-price disruption linked to the Iran war triggered a broad selloff in global bond markets.
ECB President Christine Lagarde said on Friday that the Iran war would continue to push up euro area inflation even if the Strait of Hormuz were reopened immediately.
By Friday, money markets were pricing in approximately 65 bps of ECB tightening this year, equivalent to two rate increases and a 60% probability of a third. That was down from more than 70 bps earlier in the week.
The spread between the 10-year US Treasury yield and its German equivalent rose above 154 bps on Thursday, its highest level since August 2025, and was last at 152.0 bps, up 9.4 bps from 142.6 bps a week earlier.
Italian 10-year bonds outperformed across the euro area, with yields falling -8.6 bps to 3.764% on Friday and -16.6 bps over the week. The spread between Italy’s 10-year BTPs and German Bunds narrowed to 72.1 bps from 76.0 bps the previous week.
France’s 10-year OAT yield declined -8.4 bps on Friday to 3.656%, leaving it down -14.7 bps for the week.
Note: As of 4 pm EDT 22 May 2026
While every effort has been made to verify the accuracy of this information, EXT Ltd. (hereafter known as “EXANTE”) cannot accept any responsibility or liability for reliance by any person on this publication or any of the information, opinions, or conclusions contained in this publication. The findings and views expressed in this publication do not necessarily reflect the views of EXANTE. Any action taken upon the information contained in this publication is strictly at your own risk. EXANTE will not be liable for any loss or damage in connection with this publication.
هذه المقالة متاحة لأغراض معلوماتية فقط، ولا ينبغي اعتبارها عرضًا أو التماسًا لعرض شراء أو بيع أي استثمارات أو خدمات ذات صلة يمكن الإشارة إليها هنا. ينطوي التداول في الأدوات المالية على مخاطر كبيرة من الخسارة وقد لا يكون مناسبًا لجميع المستثمرين. الأداء السابق ليس مؤشرًا موثوقًا به للأداء المستقبلي.








أنشأها المتخصصون. للمحترفين.
