

Will bond markets trip investors up?


Markets in May
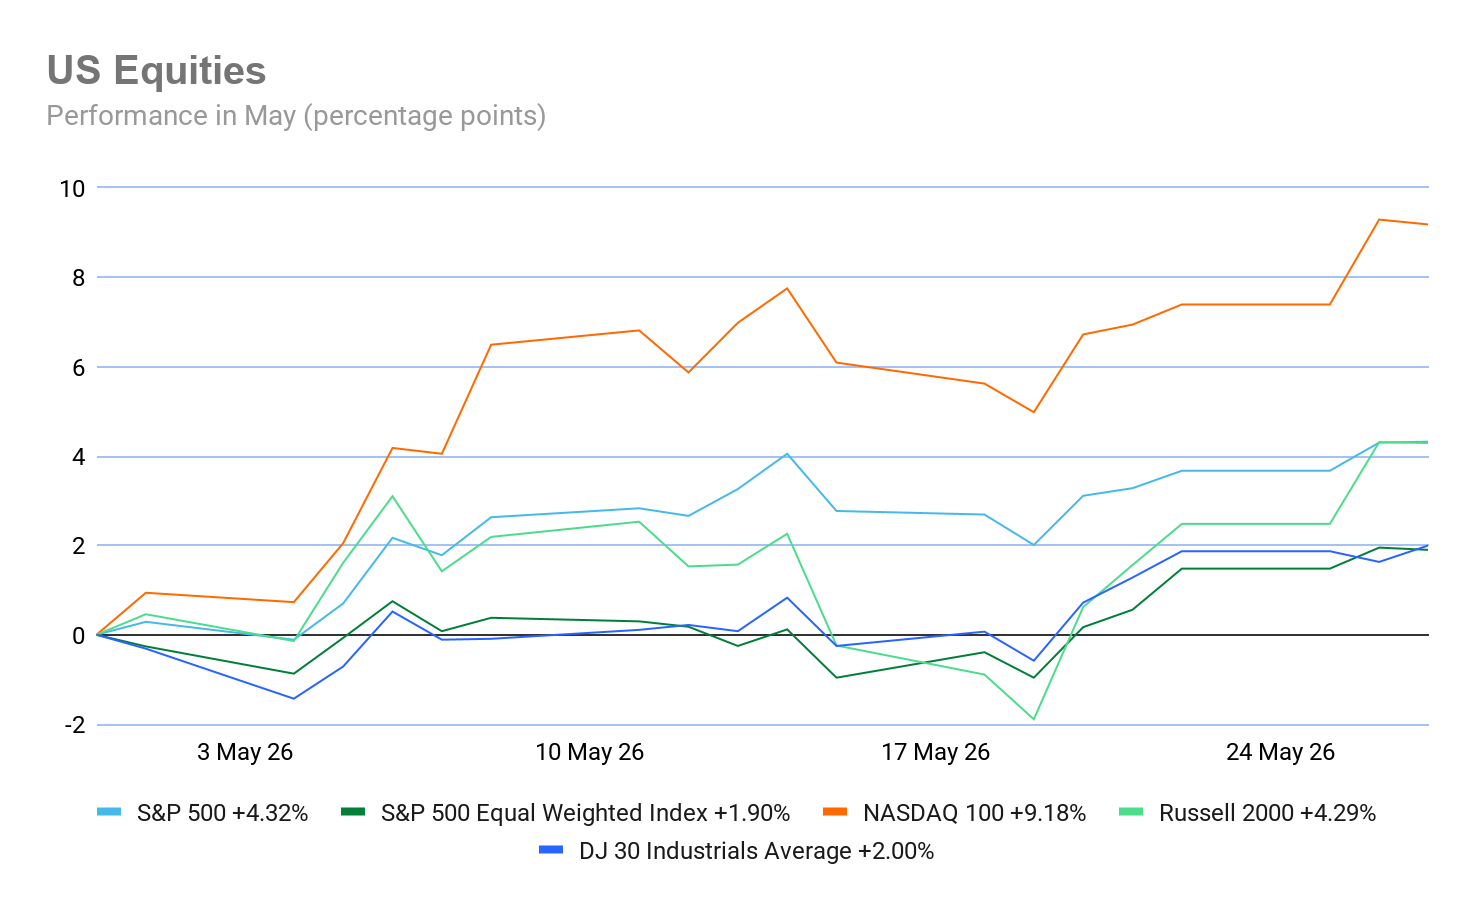
Global equity markets were largely up in May. In the US, the S&P 500 and the Nasdaq have continued to rise on a stronger than expected earning season. The (MTD) performance: S&P 500 +4.32%, Nasdaq 100 +9.18%, Dow Jones Industrial Average +2.00% and the Russell 2000
Global bond markets saw yields soar this month, with the longer maturity sovereign bonds reaching their highest levels in nearly twenty years across the US, Japan and Germany. The continuing war with Iran has led to rising inflation fears driven by higher energy prices, reflected in higher than expected CPI and PPI in the US. Escalating government debt issuance and mounting AI structural costs have also contributed to negative investor sentiment. Over the month, the US yield curve has bear flattened, narrowing the spread between 2 and 10-year yields by 5.7 bps. The US dollar index is +1.15% MTD as safe haven demand. Gold fell again in May as expectations of higher for longer rate environments remained, making the non-yielding asset less attractive.
The economic picture
USA: US economic data released in May indicates that the US economy is still holding steady. The weekly and monthly ADP reports point to a resilient and stable labour market. According to ADP, private employers added an average of 35,750 jobs per week during the four weeks ending 9 May. The prior reading 4-week average was 40,750 jobs. The US Bureau for Labor Statistics showed that the US labour market in April 2026 added 115,000 non-farm payroll jobs and the national unemployment rate was 4.3%. Average hourly earnings rose by 3.6% y/o/y, but real average hourly earnings for all employees decreased 0.5 per cent from March to April this year. On the growth front, business activity has remained steady in May, with the S&P Global Flash US Composite PMI coming in at 51.7, unchanged from April. The Flash Services PMI came in at 50.9, edging down from April’s 51.0. However, the Flash Manufacturing PMI rose to 55.3 from April’s 54.5, a 48-month high on temporary stock building. As noted by S&P, surging input costs, which jumped in May at the steepest rate since late 2022 on the back of rising war-related supply constraints and steep energy cost increases, were not only cited as causing lower sales, but also contributed to increasing job losses and a further rise in selling price inflation to its highest since August 2022. On the consumer side, the Conference Board’s Consumer Confidence Index edged down to 93.1 in May, but still came in above expectations of 92.0. April was revised higher to 93.8 from 92.8. The report noted that consumers remained increasingly concerned about prices and oil and gas for a second consecutive month, while references to geopolitical risks and their inflationary implications also stayed elevated. The Present Situation Index fell 3.2 points to 121.2 as assessments of both business conditions and the labour market softened. In contrast, the Expectations Index rose 1.0 point to 74.4, reflecting a modest improvement in views on business and labour market conditions over the next six months. However, household income expectations weakened. The labour market differential, which measures the share of consumers who say jobs are plentiful less those who say jobs are hard to get, narrowed by 0.6 points to 6.9. Consumers’ 12-month inflation expectations eased modestly in May but remained elevated, while nearly half of respondents continued to expect interest rates to be higher over the next year. The May reading of the University of Michigan confidence survey indicated that US consumer sentiment fell for the third straight month as supply disruptions in the Strait of Hormuz continue to boost petrol prices. Sentiment is now just below the previous historical trough seen in June 2022. It fell to 44.8 from April’s 49.8. The cost of living continues to be a first-order concern, with 57% of consumers spontaneously mentioning that high prices were eroding their personal finances, up from 50% last month. Long-run inflation expectations climbed from 3.5% in April to 3.9% in May, notably higher than the 2.8% to 3.2% range seen in 2024. Annualised headline inflation rose to an annual rate of 3.8% in April 2026, up from 3.3% in March, according to the Bureau of Labor Statistics. It was +0.6% on a seasonally adjusted basis m/o/m after rising 0.6% in March. Core annualised CPI was +2.6% y/o/y and 0.2% m/o/m.
EU: The eurozone is experiencing higher inflation and slower growth. Eurozone headline inflation rose 3.0% in April 2026, up from 2.6% in March. This marked the highest rate since September 2023, largely driven by a sharp 10.9% surge in energy costs due to Middle East supply constraints. The S&P Eurozone Flash Composite PMI for May fell to 47.5, down from April’s 48.8 and a 31-month low. The Flash Services PMI came in at 46.4, down from April’s 47.6 and a 63-month low. The Flash Manufacturing PMI also fell, coming in at 51.4, down from April’s 52.2 and a 3-month low. The rate of input cost inflation rose for the seventh consecutive month in May, hitting a three-and-a-half-year high. Steep rises were seen across both the manufacturing and services sectors. Average prices charged for goods and services
rose at the fastest pace in 38 months, but the pace of inflation quickened only fractionally from that seen in April. However, European consumers are not in a complete state of despair. According to the European Commission, the flash estimate of the consumer confidence indicator showed a slight rebound in the EU, +1.7 percentage points compared with April, to -19.0 from -20.6 in April. Nevertheless, consumer confidence remains well below its long-term average and below the level observed before the outbreak of the war with Iran. The ECB’s wage tracker indicates negotiated wage growth with smoothed one-off payments of 3.2% in 2025 and 2.3% in 2026. The headline ECB wage tracker averaged 1.8% in the first quarter, 2.1% in the second quarter and 2.6% in the third and fourth quarters. Although above the ECB’s target rate, wage growth rate of around 3% is considered balanced by the ECB.
UK: The UK economy appears to be coming under increasing strain. Business activity at UK private sector firms decreased in May, ending a 12-month period of expansion. The S&P Global Flash Composite PMI fell to 48.5, down from April’s 52.6 and a 13-month low. The Flash Services PMI fell to 47.9, a significant drop from April’s 52.7 reading and a 64-month low. The Flash Manufacturing PMI was unchanged from April’s 53.7. The May data highlighted that private sector payroll numbers fell for the twentieth successive month, largely due to a faster pace of job shedding in the service economy. Backlogs of work also decreased again, suggesting a lack of pressure on business capacity. Input price inflation had eased slightly since April, but remained well above its long-run average. According to S&P, around 66% of manufacturing companies and 51% of service providers indicated an increase in their average cost burdens during May. This was overwhelmingly linked to rising oil prices and transportation bills, alongside higher energy and raw material costs. Headline inflation in the UK fell to its lowest in more than a year in April, dropping to 2.8% from March’s 3.3%. The drop was largely attributed to an energy price cap introduced by the energy regulator on 1 April. Core inflation was 2.5% in April 2026 and rose by 0.7% m/o/m in April 2026, accelerating from March’s 0.4% m/o/m increase. However, this is expected to be only a temporary reprieve as consumer prices are expected to increase as higher energy costs due to the Iran war continue to filter through. According to the Office for National Statistics (ONS) May 2026 release, the UK economic inactivity rate rose by 0.1 percentage points to 20.9%. The ONS reported that the headline unemployment rate sat at 4.9% for the February-April period, though for the quarter ending in March, unemployment rose slightly to 5.0%. The number of payrolled employees dropped by 100,000 in April following a 28,000 decline in March. The labour market is becoming increasingly fragile with job vacancies at their lowest level since 2021.
Global market indices
USA:
S&P 500 +4.32% MTD and +9.86% YTD
Nasdaq 100 +9.18% MTD and +18.71% YTD
Dow Jones Industrial Average +2.00% MTD and +5.37% YTD
NYSE Composite +0.53% MTD and +5.74% YTD
Source: FactSet
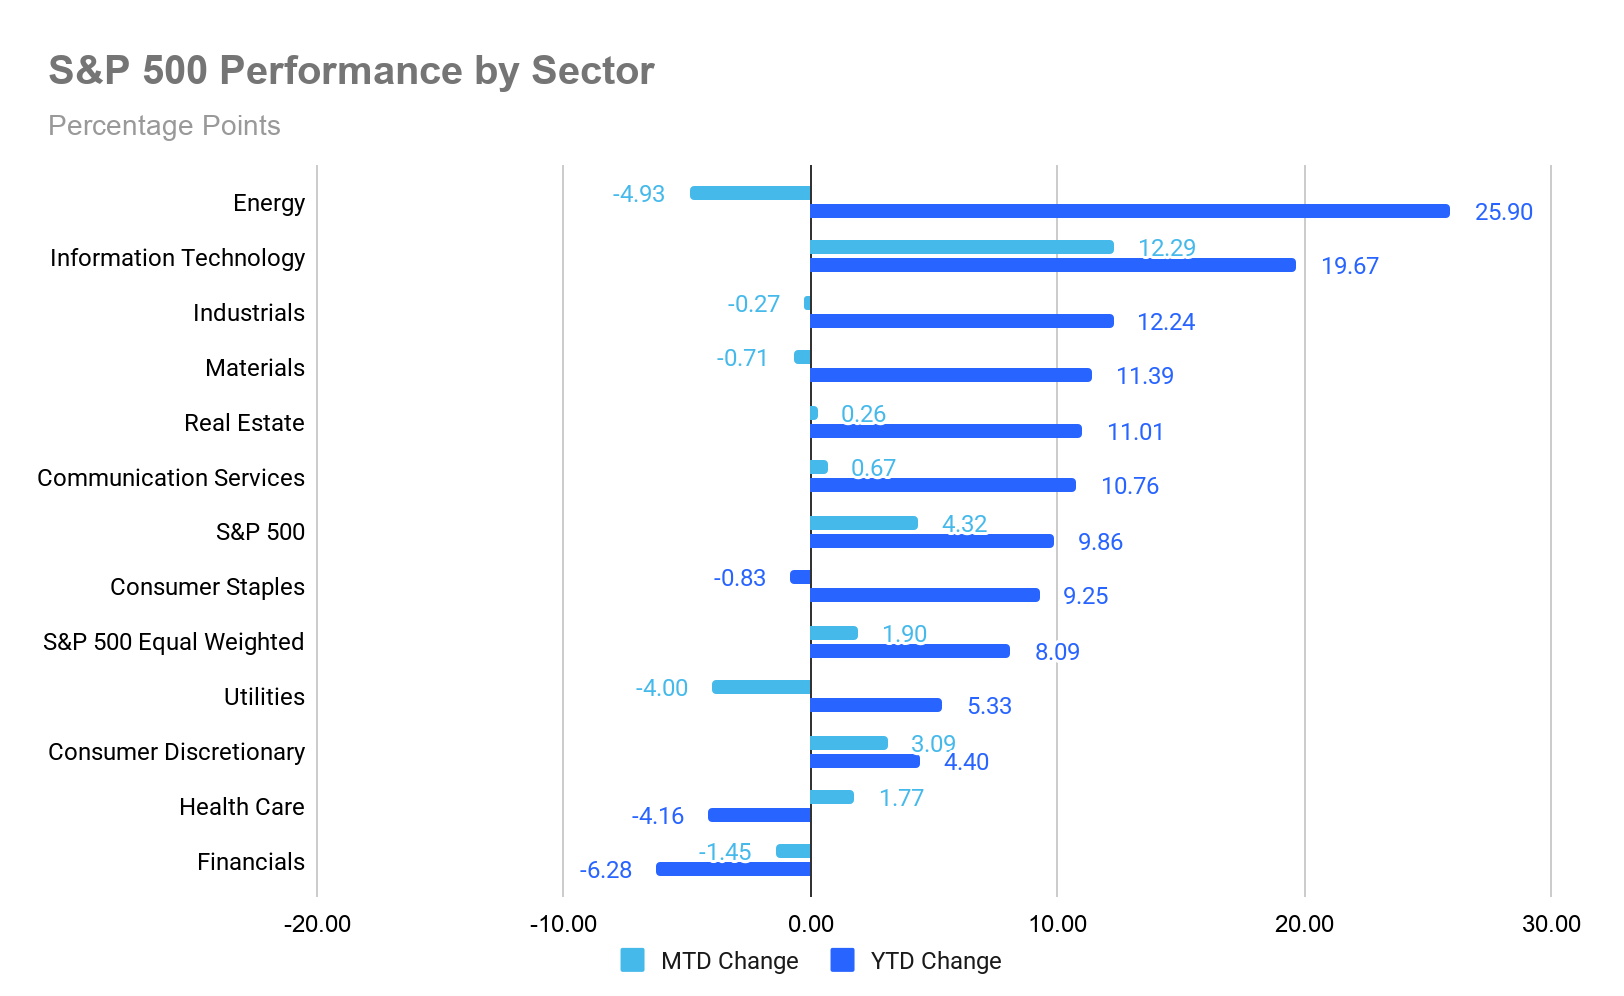
The Equally Weighted version of the S&P 500 is +1.90% MTD so far in May, 2.42 percentage points lower than the benchmark.
The S&P 500 Information Technology sector is the top performer thus far in May at +12.29% MTD and +19.67% YTD, while Energy underperformed -4.93% MTD and +25.90% YTD.
On Wednesday the three major US stock indexes closed at record highs, with gains of less than half a percentage point. The S&P 500 was +0.02%, the Nasdaq Composite +0.07% and the Dow Jones Industrial Average was +0.36%.
Memory-chip maker Micron surpassed the $1 trillion market-cap milestone on Tuesday, reaching the threshold in record time. Following its sharp advance, the company became the 12th US-listed company to achieve a $1 trillion valuation, marking the fastest rise to a 13-figure market value on record. According to Dow Jones Market Data, Micron reached the milestone just 48 days after first attaining a $500 billion valuation.
In corporate news, PDD, the Chinese parent of Temu, reported weaker-than-expected first-quarter profit amid intense domestic competition and mounting regulatory pressure.
Salesforce reported stronger Q1 profit and revenue and raised the lower end of its full-year revenue guidance.
Meta Platforms has begun offering paid consumer subscriptions for its Meta AI chatbot, marking an important step in building a revenue stream to help offset the company's substantial AI CapEx.
Europe:
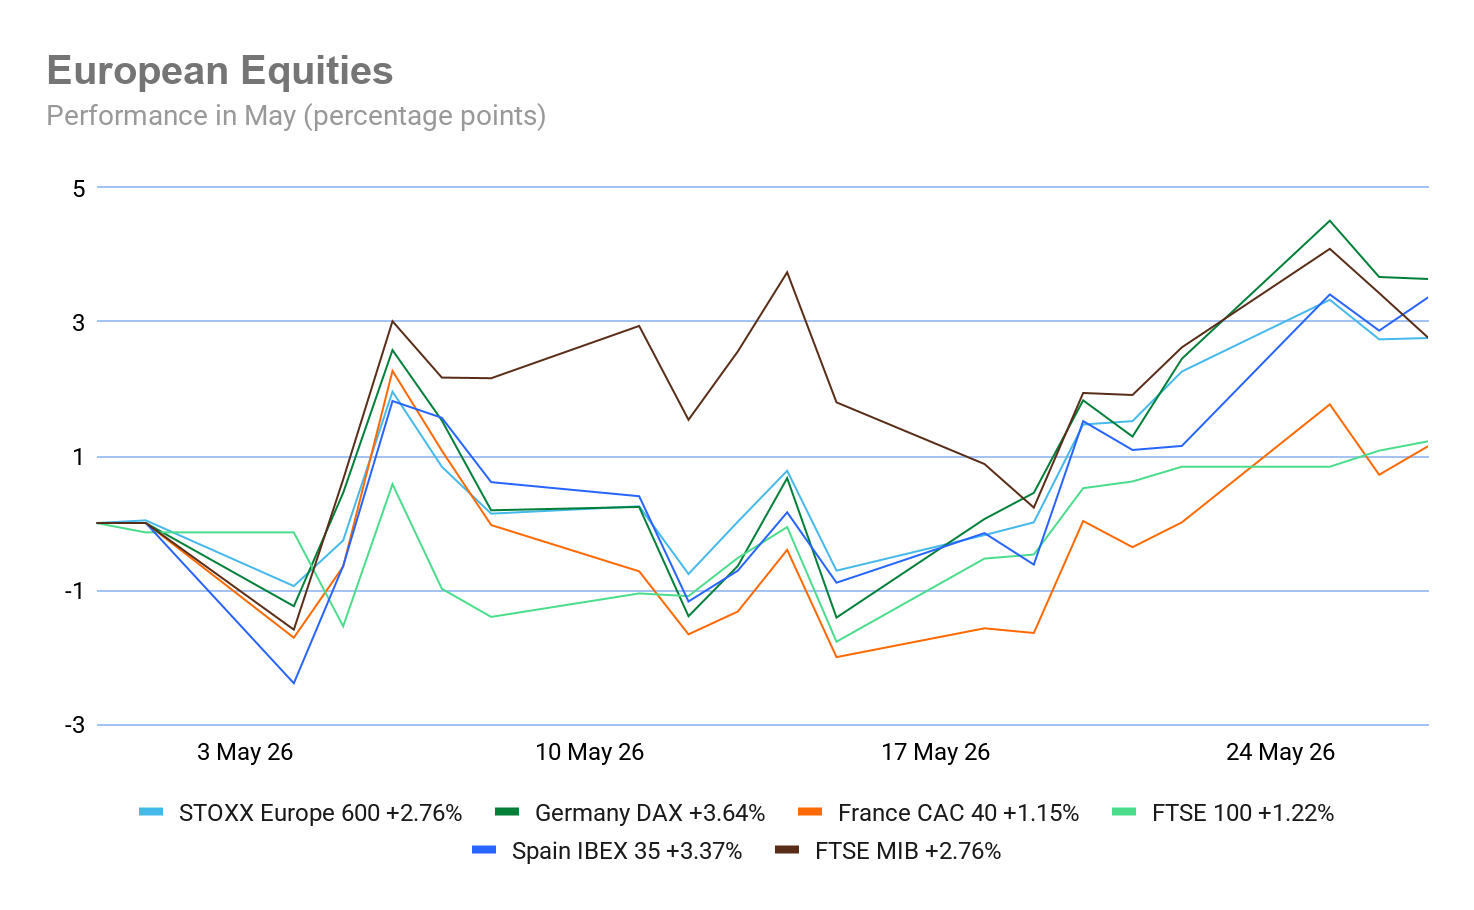
Stoxx 600 +2.76% MTD and +6.08% YTD
DAX +3.64% MTD and +2.81% YTD
CAC 40 +1.15% MTD and +0.72% YTD
FTSE 100 +1.22% MTD and +5.78% YTD
IBEX 35 +3.37% MTD and +6.20% YTD
FTSE MIB +2.76% MTD and +10.31% YTD
Source: FactSet
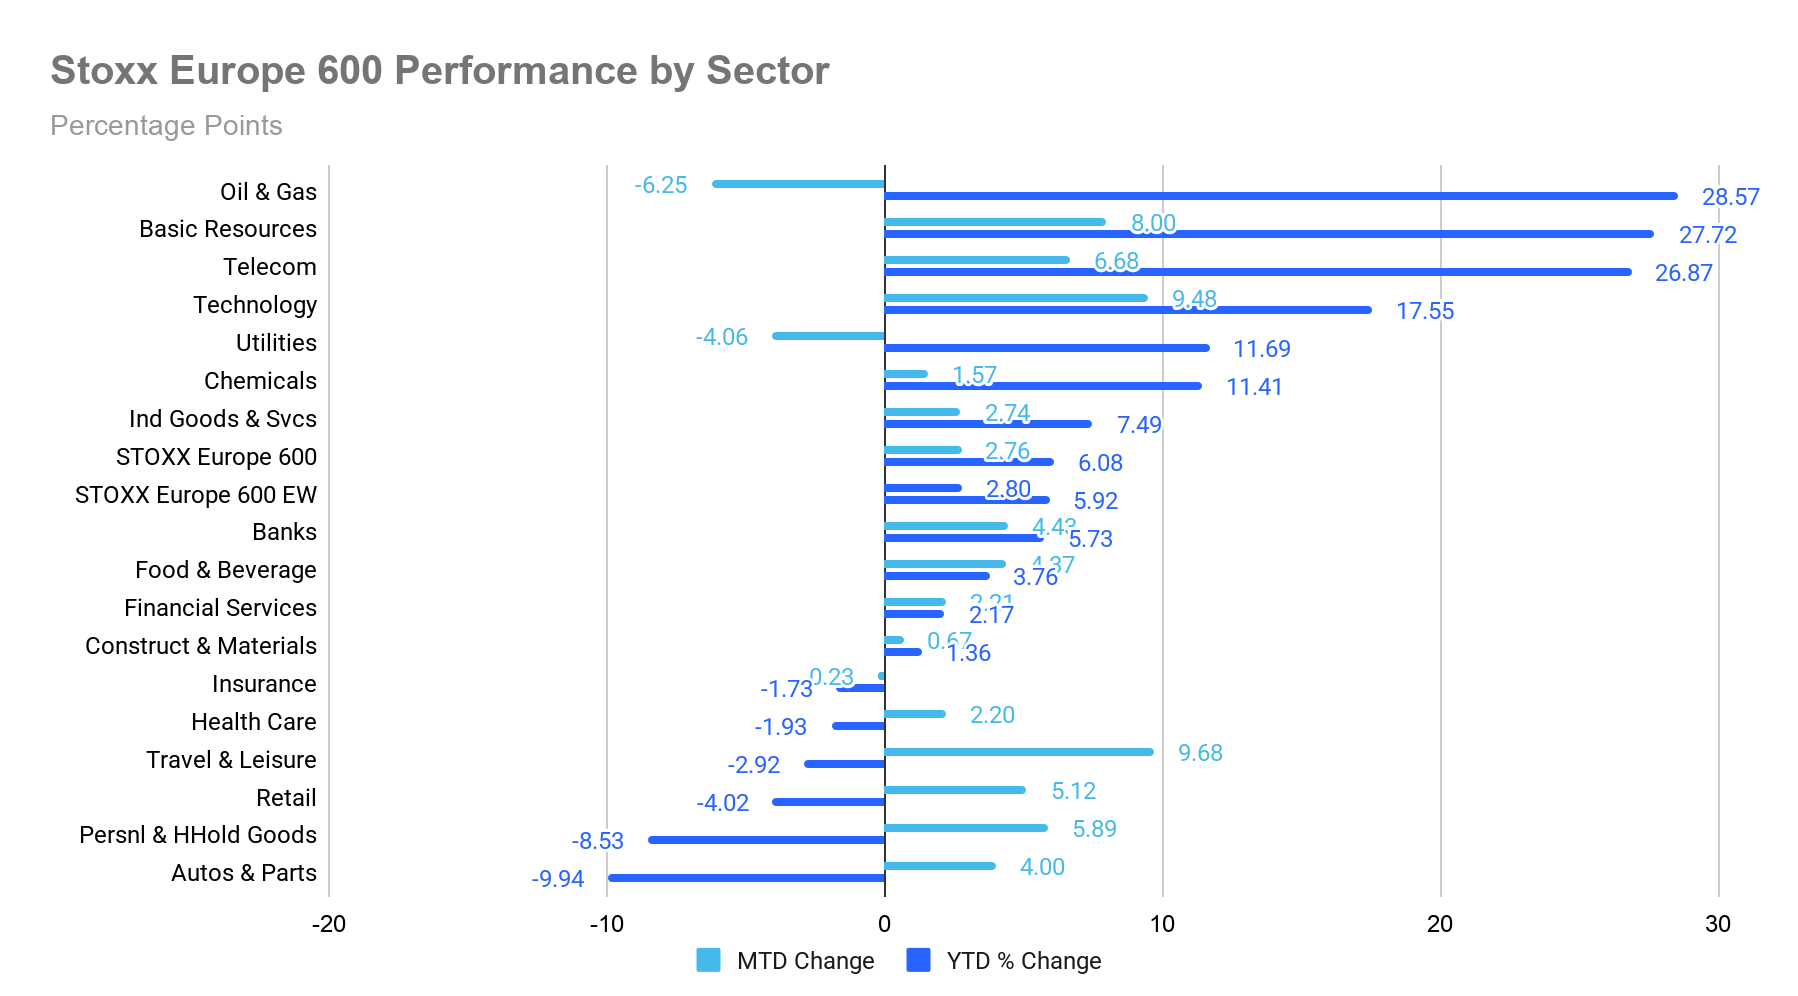
In Europe, the Equally Weighted version of the Stoxx 600 is +2.80% MTD, 0.04 percentage points higher than the benchmark.
The Stoxx 600 Travel & Leisure is the leading sector, +9.68% MTD and -2.92% YTD, while Oil & Gas exhibited the weakest performance at -6.25% MTD and +28.57% YTD.
On Wednesday, Autos & Parts outperformed, supported by improving European auto registration data and easing regulatory concerns. Volvo advanced after receiving US government approval to continue selling China-linked vehicles in the country, removing a significant overhang. Personal & Household Goods also moved higher, with Pernod Ricard advancing despite Indian authorities seeking $314 million in back taxes related to whisky imports.
Retail names advanced, led by Pets At Home after the company reported FY earnings slightly ahead of expectations and guided to improved FY27 profit, alongside an additional buyback. Specialty retail also was supported, with Auto Trader Group slightly higher following an upgrade from Peel Hunt, which cited resilient earnings and the platform's relative insulation from AI disruption.
Travel & Leisure traded higher as lower oil prices eased some pressure on fuel costs, although uncertainty surrounding the Middle East ceasefire remained. Deutsche Lufthansa stated that fuel supply conditions remain stable and encouraged customers to book summer travel. Chemicals outperformed, led by Akzo Nobel after the company rejected a joint takeover proposal from Nippon Paint and Sherwin-Williams.
Oil & Gas underperformed as crude prices retreated on reports of continued progress in US-Iran peace negotiations, despite the latest skirmish. Utilities traded lower, with Naturgy Energy Group falling after CVC exited its remaining stake through a large block sale. Renewable energy names also came under pressure despite Ofgem announcing a higher UK energy price cap for Q3. Media, Telecom and Health Care also traded lower amid rotation into cyclical sectors.
Global Equities
MSCI World Index +3.59% MTD and +8.98% YTD
Hang Seng -1.74% MTD and -1.18% YTD
Mega cap stocks have had a positive performance MTD. Thus far in May, Tesla +15.39%, Apple +14.56%, Nvidia +6.53%, Meta Platforms +3.82%, Amazon +2.56%, Microsoft +1.20% and Alphabet +1.05%.
Energy stocks experienced a negative performance so far in May with the Energy sector -4.93% MTD. So far in May, Marathon Petroleum -0.50%, Phillips 66 -2.52%, ExxonMobil -4.17%, Chevron -5.64%, Occidental Petroleum -6.09%, Shell -6.19%, Halliburton -6.38%, ConocoPhillips -8.47%, Baker Hughes Company -9.29%, Apa Corp -10.09% and Energy Fuels -13.79%.
Materials and Mining stocks have had a mixed performance MTD in May. The Materials sector is -0.71% MTD. So far this month, Freeport-McMoRan +10.12%, Nucor Corporation +9.40% and Mosaic +1.93%, while Sibanye Stillwater -1.49%, Newmont Mining -3.47%, CF Industries Holdings -6.33%, Yara International -7.16%, Albemarle -9.78% and Celanese Corporation -21.89%.
Commodities
Gold prices fell to a two-month low on Wednesday as expectations of tighter monetary policy to curb inflation weighed on the market, while the US-Israel war with Iran showed no clear sign of ending.
Spot gold fell -1.12% to $4,457.03 an ounce after earlier hitting its lowest level since 27 March. It is -1.78% MTD and +3.31% YTD.
Spot silver declined -3.01% to $74.61 per ounce. It is -1.77% MTD and +4.70% YTD.
Oil prices settled more than four percent lower on Wednesday as investors awaited further clarity on a potential framework agreement between Washington and Tehran aimed at ending the conflict and reopening the Strait of Hormuz.
Brent crude futures settled down $4.71, or -4.73%, at $94.90 a barrel, while US WTI crude fell $4.19, or -4.48%, to $89.43.
Brent is -16.82% MTD and +55.80% YTD, while WTI is -15.16% MTD and +55.77% YTD.
Both benchmarks touched their lowest levels in a month earlier in the session, and the decline more than erased Brent's gains from Tuesday.
WTI and Brent extended their declines after Iranian television reported that a draft of an unofficial framework for a preliminary MOU with the US had been prepared. The White House denied that any MOU had been reached. The scale of the initial selloff was somewhat surprising, as the reported framework appeared closer to an Iranian wish list than to a negotiated compromise between the two sides. Even so, although both parties have continued to adopt a hard line in public, negotiations remain under way and most market participants believe the administration wants to secure a deal.
Bloomberg news reported on Wednesday afternoon that tanker traffic in the Strait had slowed to a crawl. Additional overnight reports, following similar reports on Monday, indicated that Asian countries outside China saw crude imports and refinery runs rise in May from April, supported in part by the continued decline in Chinese imports. TankerTrackers also reported that 60 million barrels of Iranian oil remain stranded on tankers as a result of the US blockade.
In Venezuela-to-India trade, tanker data showed that seven VLCCs carrying Venezuelan crude were currently en route to India.
Additionally, in a further sign of weakening demand, India's two largest airlines sharply reduced planned domestic flights for June and July.
The US Department of Energy said on Tuesday that 9.1 million barrels were released from the Strategic Petroleum Reserve in the week ended 22 May, following a record 9.9 million-barrel release in the previous week. SPR stockpiles are now down by more than 50 million barrels since the war in Iran began.
The EIA’s Weekly Petroleum Status Report report will be released today.
Currencies
The safe-haven dollar steadied on Wednesday, extending the previous session's gains. The dollar index rose +0.08% to 99.23, marking a second consecutive session of gains. The US dollar index is +1.15% MTD and +0.97% YTD.
The euro edged up +0.02% to $1.1626 on Wednesday, while sterling fell -0.10% to $1.3427. Against the US dollar, the euro is -0.90% MTD and -1.01% YTD. The British pound is -1.29% lower against the US dollar MTD and -0.10% YTD.
The yen weakened to its lowest level in nearly four weeks on Wednesday, moving closer to the levels that prompted Japanese authorities to intervene last month. The currency fell -0.09% to ¥159.44 per dollar, its weakest level since 30 April, when authorities stepped in to support it.
Market participants continue to view the ¥160 level as a key threshold for potential intervention after the yen crossed that mark last month. The yen is -1.85% MTD and -1.78% YTD.
Markets are pricing in an approximately 70% probability of a quarter-point interest rate increase at the BoJ's 15 - 16 June policy meeting.
Cryptocurrencies
Bitcoin -2.55% MTD and -15.29% YTD to $74,362.29
Ethereum -10.52% MTD and -32.23% YTD to $2,018.61
Bitcoin was -2.30% and Ethereum was -2.88% on Wednesday. Throughout May cryptocurrencies maintained a steady, narrow price range despite broader geopolitical tensions. The broader macroeconomic environment, including rising inflation concerns, has kept investors cautious. The Fed’s higher-for-longer stance has raised Treasury yields and prompted institutional de-risking from non-yielding assets. Spot ETF outflows have created downward price pressure on Bitcoin and Ethereum. Investors will be looking ahead to when the Clarity Act is passed through the Senate and brings formal structure and rules to the US market.
Note: As of 5:00 pm EDT 27 May 2026
Fixed Income
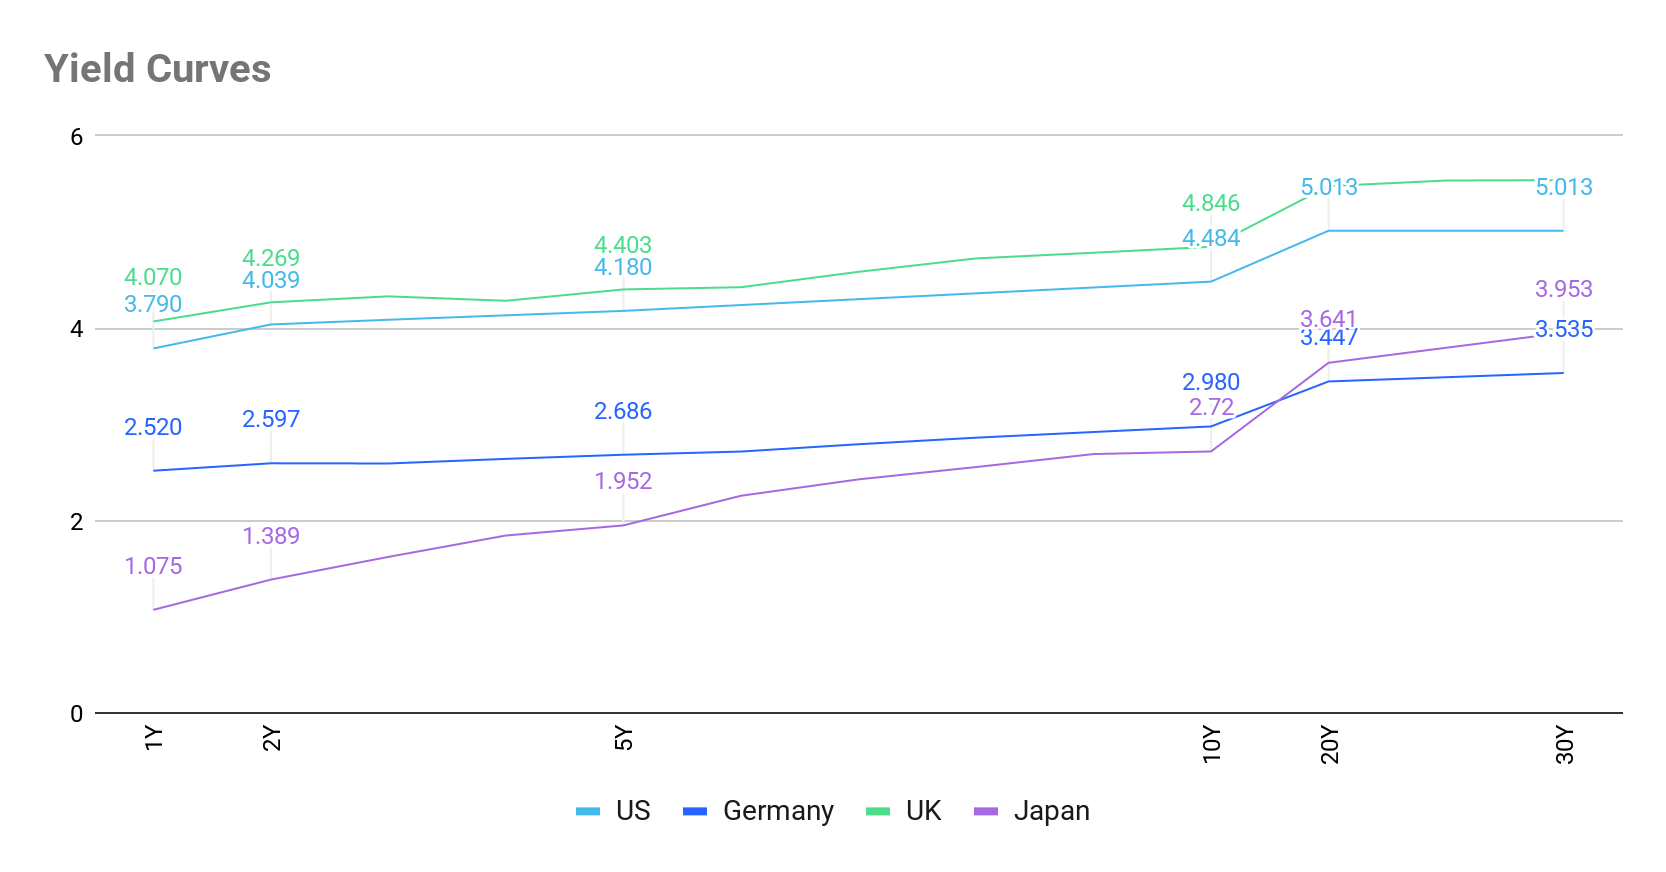
US 10-year yield +10.9 bps MTD +31.2 bps YTD to 4.484%
German 10-year yield -6.1 bps MTD +12.0 bps YTD to 2.980%
UK 10-year yield -17.7 bps MTD +36.8 bps YTD to 4.872%
US Treasury yields were little changed on Wednesday, retaining the previous session's declines amid continued expectations that Washington and Tehran may reach an agreement to end their three-month conflict.
The US Treasury auctioned $70 billion of five-year notes in the afternoon, with demand modestly firmer and broadly in line with longer-term trends at 2.34x the amount offered.
The US 10-year Treasury yield fell -0.8 bps to 4.484%, while the 30-year bond yield also declined -0.8 bps to 5.013%.
The two-year US Treasury yield, closely tied to expectations for Fed policy, eased -0.3 bps to 4.039%.
The yield curve was slightly changed on Wednesday, with the spread between the two- and 10-year yields narrowing 0.5 bps to 44.5 bps from 45.0 bps at the end of Tuesday’s session.
Over the month, the US yield curve has bear flattened, narrowing the spread by 5.7 bps, with the spread between two- and 10-year yields at 44.5 bps on Wednesday, from 50.2 bps at the end of April.
The yield on the US 10-year Treasury note is +10.9 bps MTD for May. The US 30-year yield is +4.5 bps over the course of the month. At the short end, the two-year Treasury yield is +16.6 bps MTD.
Current sentiment in the Fed funds futures market, according to CME's FedWatch Tool, suggests a 1.1% probability of rates decreasing to the 3.25 - 3.50% range at the June FOMC meeting, lower than the 5.6% implied probability one month ago.
Source: FactSet
In the UK, the 10-year gilt declined by -3.2 bps to 2.980% on Wednesday. On the short end, the 2-year gilt was -1.3 bps lower to 4.287%. The UK's 30-year gilt yield advanced +0.7 bps to 5.569%. In the UK, the 10-year gilt yield is -17.7 bps MTD. The UK 30 year is -13.0 bps so far in May.
Across the channel, eurozone government bond yields moved lower on Wednesday, while Bund yields edged modestly higher.
Investor expectations for ECB rate increases this year were little changed. Money markets are pricing the ECB deposit rate at 2.59% by December, up from the current 2.00% but below the 2.75% level priced in last week. They also imply an 80% probability of an initial 25 bps increase next month.
Germany's two-year Schatz yield, sensitive to ECB deposit rate expectations, rose +0.5 bps to 2.597%. Earlier this week, it fell to 2.523%, its lowest level since 7 May.
Germany's 10-year government bond yield was unchanged at 2.980%, while the 30-year yield rose +1.7 bps to 3.535%.
Italy's 10-year government bond yield fell -1.6 bps to 3.695%. The spread between Italian 10-year BTPs and Bunds stood at 71.5 bps.
The German 10-year yield is -6.1 bps MTD for May. The spread between US 10-year Treasuries and German Bunds stands at 150.4 bps, reflecting an increase of 17.0 bps over the month so far, from 133.4 bps at the end of April.
The 2-year Schatz declined -5.3 bps MTD and the German 30-year yield is -1.1 bps lower MTD.
France’s 10-year OAT yield has declined by -9.9 bps MTD to 3.591%. The spread of French government bonds versus German Bunds has declined by 3.8 bps over the month to 61.1 bps, from 64.9 bps at the end of April.
During May the spread of Italian 10-year BTPs over Bunds has narrowed by 10.0 bps so far. The Italian 10-year BTP yield has decreased by -16.1 bps MTD.
ECB Financial Stability Review: elevated vulnerabilities in a geoeconomic storm. The ECB's May 2026 Financial Stability Review warns that financial stability vulnerabilities remain elevated as the geoeconomic shock unleashed by the war in the Middle East continues to unfold. The closure of the Strait of Hormuz has effectively disrupted global energy supply chains, generating sharp increases in oil and gas prices and amplifying macro-financial stress across the euro area. ECB Vice-President Luis de Guindos underscored at the press briefing that the energy supply shock poses clear upside risks to inflation and downside risks to growth, while also raising the prospect of increased market volatility and deteriorating debt servicing capacity as financing costs rise.
In the fixed income space, sovereign bond markets face mounting pressure from rising yields, a shifting investor base and growing concerns over fiscal credibility. Higher term premia and renewed inflation expectations have driven sovereign yields upward across major advanced economies, increasing debt servicing costs and compressing the already limited fiscal space available to highly indebted euro area governments. The Review explicitly flags the risk of a sovereign risk repricing, which could be amplified by price-sensitive market participants, such as hedge funds, that have grown increasingly active in euro area bond markets. A fiscal response to the energy shock, including defence spending commitments and energy subsidies, risks further widening sovereign spreads if sustained inflationary pressures erode market confidence.
On the foreign exchange front, the US dollar has appreciated against the euro, reflecting the euro area's greater relative exposure to the energy shock and reinforcing safe-haven flows into dollar-denominated assets. Non-bank financial institutions, heavily weighted toward US dollar assets, face mounting exchange rate and valuation risks, with concentrated AI-related equity exposures adding another layer of sensitivity to sudden repricing.
The Review also identifies meaningful upside risk scenarios: a more persistent energy disruption than markets currently price in, a re-escalation of geopolitical tensions or a sudden deterioration in inflation expectations could trigger abrupt sentiment shifts across asset classes. Meanwhile, the potential for AI-driven productivity gains to support risk appetite, and for a swift resolution of Middle East hostilities, represents a countervailing upside that has kept equity valuations stretched and corporate credit spreads compressed. The interplay between these forces underscores the ECB's caution: markets may be systematically underestimating downside risks while simultaneously overpricing the probability of a benign resolution.
Note: As of 5:00 pm EDT 27 May 2026
What to think about in June 2026
Heading to the halfway mark. As investors look towards the end of H1, certain risks are likely to remain, such as geopolitical tensions in the Middle East, the war in Ukraine and frictions in the South China Seas. There is also likely to be continuing supply disruptions and price volatility in energy markets stemming from the war in Iran as well as a higher for longer global rate environment as central banks remain cautious over secondary effects from the energy price surge. Geoeconomic fragmentation may not recede as supply chains are permanently rerouted into "friend-shored" or regionalised blocs. In addition, the AI driven CapEx cycle is putting increasing pressure on credit markets. According to the Federal Reserve Bank of Dallas, the infrastructure assets being financed have led these tech companies to issue longer-maturity bonds. As hyperscalers increasingly tap bond and private credit markets to fund infrastructure development, they are pushing up yields. This may begin to raise concerns about sustained returns. As noted by Goldman Sachs, sharp bond market moves have coincided with negative equity returns in the past, with steeper yield increases generally generating bigger declines in the stock market. Nevertheless, it is highly probable that heavy investment in AI infrastructure is likely to continue despite these risks. This should, at least in the short term, be supportive to most asset classes. However, with consumers becoming less confident as the secondary effects of the energy shock became more evident, corporates may not be able to meet ever higher performance expectations in Q2 and beyond. This may push investors to re-align their focus to Heavy Assets, Low Obsolescence (HALO) companies that own physical, capital-intensive infrastructure that, although they may benefit from some of the capabilities offered by AI, are immune to being replaced by AI.
Heading into H2, the equity picture is constructive, but not without complexity. Q1 S&P 500 earnings beat expectations by 8.0%, the strongest beat rate in four years. Yet the very resilience driving this optimism is producing its own vulnerability. AI-related exposures, having pushed several indices to new cycle highs, means the market may be building a valuation overhang that will need to be resolved, particularly it is still not fully clear AI revenue benefits can justify the scale and concentration of capital flowing to the chip and hyperscaler layers. Single-stock volatility has risen sharply while index-level correlations are near record lows. This suggests any macro shock capable of raising correlations could amplify broad index drawdowns rapidly. Investors should therefore consider pairing equity overweights with long exposure to longer-dated volatility, retaining upside while managing tail risk.
The fixed income landscape entering H2 is shaped by the energy-price shock that is compressing growth. Yields have reset hawkishly across developed market curves, with the US 10-year having moved well above pre-war levels. The scope for near-term easing remains constrained as long as energy supply disruptions persist and sequential inflation prints remain elevated. US terminal rates have been dragged higher by the conflict in the Middle East and by rising term premia in the UK and Japan. Should energy flows through the Strait of Hormuz begin to recover, however, front-end rates are most positioned to benefit from a repricing of Fed fund rates expectations, with shorter-duration instruments offering the most attractive risk-reward in that scenario.
The commodity complex has emerged as one of the clearest beneficiaries of the shortage regime that Goldman Sachs identifies as the defining cross-asset theme of this cycle. Gold is the most direct expression of that dynamic, driven by sustained central bank demand, ETF inflows, US dollar softness and structural diversification away from dollar-denominated reserves as a durable driver. Copper remains the preferred industrial metal for a number of institutions, given tight mine supply and the structural demand impulse from electrification and the energy transition, trends that are independent of near-term cyclical conditions. Broader infrastructure, including power and digital networks, is seeing capital inflows that align precisely with the HALO thesis noted above: physical assets with low obsolescence, essential to both the AI build-out and the energy security imperative, and increasingly financed through private capital structures.
EM equities have delivered meaningful year-to-date outperformance, driven by a barbell of semiconductor exposure in North Asia, with Korea and Taiwan being the primary beneficiaries of the AI memory and logic cycle, and commodity producer exposure in Latin America. That differentiation is likely to persist. JP Morgan notes that EM GDP growth is set to outpace developed markets, underpinned by stronger demographics, rising domestic consumption and continued investment into manufacturing and digital ecosystems, while valuations remain at a significant discount to US peers. The case for maintaining EM exposure is also supported by the carry environment. South Asian oil consumers represent the primary risk to this view, with the terms-of-trade divergence between energy producers and importers remaining one of the sharpest cross-EM fault lines heading into H2.
Key events in June 2026
The potential policy and geopolitical risks for investors that could affect corporate earnings, stock market performance, currency valuations, sovereign and corporate bond markets and cryptocurrencies include:
7 June OPEC+ Summit, Vienna. The 41st OPEC and OPEC+ Ministerial Meeting will review the market impacts of a previous agreement made in May when seven OPEC+ countries, Saudi Arabia, Russia, Iraq, Kuwait, Kazakhstan, Algeria and Oman, agreed to adjust and incrementally raise collective production by 188,000 barrels per day.
10-11 June ECB Monetary Policy Meeting. Sharply higher energy costs have pushed inflation well above the ECB’s 2% target, and several policymakers, such as Executive Board member Isabel Schnabel and Chief Economist Philip Lane, have signalled a rate rise in June as they worry that high energy costs will push up the price of other goods and services via second-round effects. However, given ongoing weakness in the eurozone economy, the ECB is likely to be cautious about the pace of rate rises and will remain data-dependent.
14-16 June G7 Leaders Summit, Évian-les-Bains, Haute-Savoie. France. The 52nd G7 Summit, including leaders of Canada, France, Germany, Italy, Japan, the UK and the US, plus the EU, will meet to discuss global economic conditions, international security, climate and development issues and other shared priorities.
15-16 June Bank of Japan Monetary Policy Meeting. Rates are widely expected to be raised to 1.0% at the June meeting due to rising inflationary pressures from the energy price surge as long as there are no clear signs of an economic slowdown.
16-17 June Federal Reserve Monetary Policy Meeting. This will be the first meeting under the new Fed chair, Kevin Warsh. Given higher than expected CPI and PPI in April along with expectations that secondary effects from the energy price surge still need to filter through, the markets are overwhelmingly pricing in a rate pause, leaving the federal funds target rate in the 3.50% - 3.75 range.
18 June Bank of England Monetary Policy Meeting. Despite April’s drop in headline inflation, inflation is expected to continue to rise in the UK as the secondary impact of the energy price surge plays out, suggesting that the BoE could raise rates. However, with labour market weakness and sluggish economic growth, traders are pricing in a stronger likelihood that the BoE will keep rates on hold at this meeting.
While every effort has been made to verify the accuracy of this information, EXT Ltd. (hereafter known as “EXANTE”) cannot accept any responsibility or liability for reliance by any person on this publication or any of the information, opinions, or conclusions contained in this publication. The findings and views expressed in this publication do not necessarily reflect the views of EXANTE. Any action taken upon the information contained in this publication is strictly at your own risk. EXANTE will not be liable for any loss or damage in connection with this publication.
This article is provided to you for informational purposes only and should not be regarded as an offer or solicitation of an offer to buy or sell any investments or related services that may be referenced here. Trading financial instruments involves significant risk of loss and may not be suitable for all investors. Past performance is not a reliable indicator of future performance.






Created by professionals. For professionals.
